
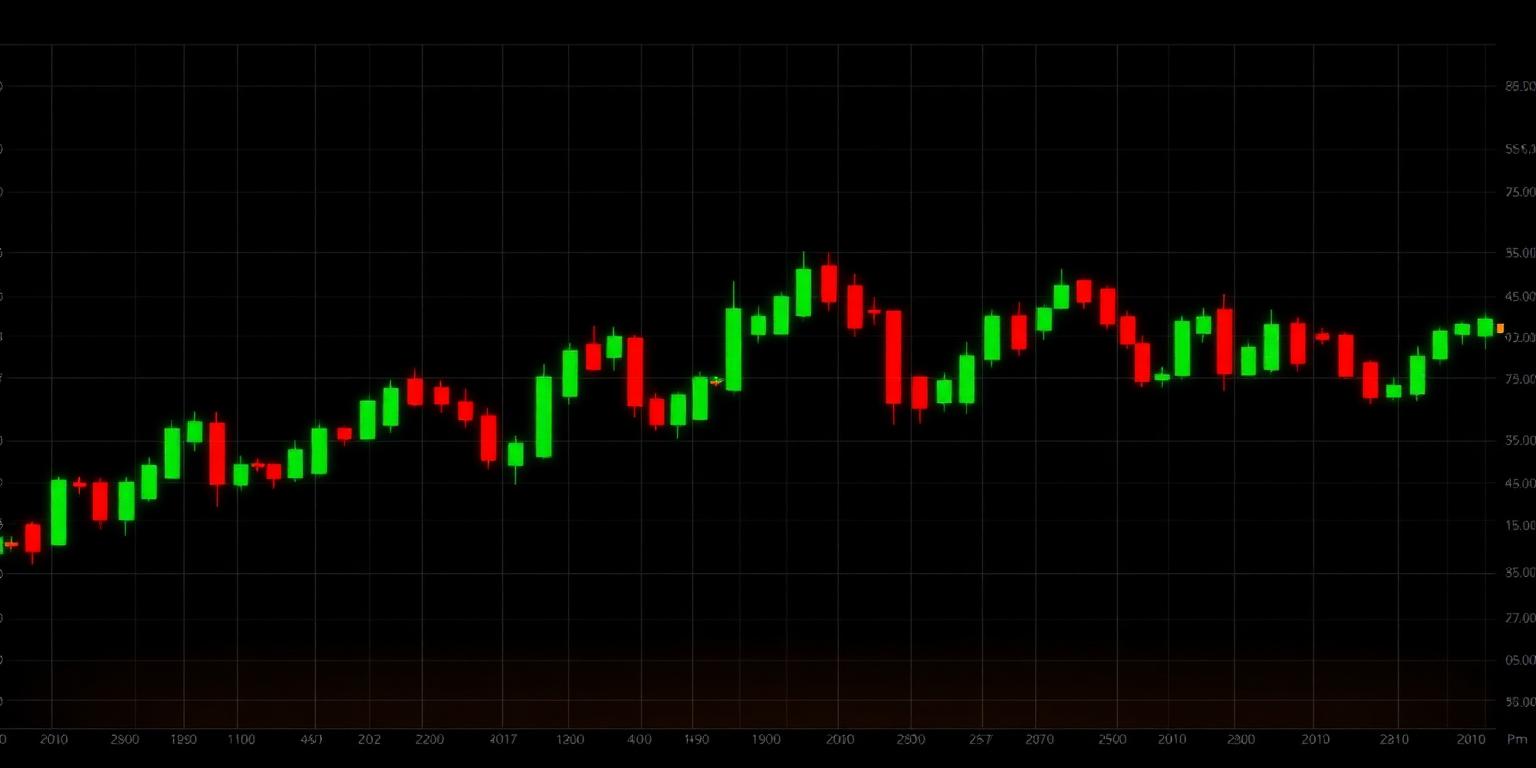
FOREX EUR/USD EUR/USD trades below its MA200 (1.16300) and MA20 (1.15740), currently at 1.16560, indicating bearish pressure. The pair is within the prior session's range, finding resistance at the day's high of 1.16810, near the 61.8% Fibonacci retracement of the 60-day swing (1.16680). A break above 1.16810 could target the 1.17123 swing high, while support is at the 50% Fibonacci level of 1.15188. Momentum indicators are neutral to slightly bearish, with price action hugging the mid-Bollinger band. Bias: Bearish below 1.16810.
GBP/USD GBP/USD is trading lower at 1.35940, below its MA20 (1.35190), but above MA50 and MA200, suggesting a potential short-term pullback within a broader uptrend. The pair is testing the 38.2% Fibonacci retracement of the 60-day swing (1.34860) as initial support. A drop below the session low of 1.35860 could see a retest of the MA20 at 1.35190. Resistance lies at the day's high of 1.36510, with the 1.36750 swing high remaining a key barrier. Bias: Neutral below 1.36510.
USD/JPY USD/JPY is trading at 159.398, above its MA200 (158.365) and MA20 (159.004), indicating a bullish bias. The pair has moved higher today, breaching the MA20 and approaching the day's high of 159.444. Initial resistance is around 159.500, with further upside potential towards the 160.00 psychological level. Support is found at the MA20 at 159.004, and the 38.2% Fibonacci retracement of the 60-day swing at 158.077. Bias: Bullish above 159.004.
AUD/USD AUD/USD trades higher at 0.71750, above its MA20 (0.70750), MA50 (0.70040) and MA200 (0.69560), indicating sustained bullish momentum. The pair has printed a new 60-day swing high today at 0.71911, demonstrating strong upward pressure. Immediate resistance is at this new swing high, with potential for further extension towards the 127.2% Fibonacci extension (0.72590). Support is at the day's low of 0.71630, then the MA20 at 0.70750. Bias: Bullish above 0.71630.
US Dollar Index (DXY) DXY is up 0.24% at 99.155, trading just below its MA200 (99.168) and MA20 (99.554), suggesting a mixed short-term trend within a longer-term range. The index is holding above the session low of 98.898, which aligns with recent support levels. A break above the MA200 at 99.168 could target the MA20 at 99.554. Conversely, a move below 98.898 could test the 98.560 60-day swing low. Bias: Neutral above 98.898.
INDICES AND FUTURES Nasdaq 100 futures (NQ) NQ futures are consolidating near 29276.75, trading below both the MA20 (29471.20) and MA50 (29437.69), signaling short-term weakness. The session range is contained within prior session's high and low, indicating indecision. Resistance is at the day's high of 29332.75, followed by the MA20. Support lies at the session low of 29096.00 and the 38.2% Fibonacci retracement of the 60-day swing at 29252.00, which has recently been tested. Bias: Bearish below 29332.75.
S&P 500 futures (ES) ES futures are at 7688.00, trading slightly below the MA20 (7709.35) but above the MA50 (7588.86) and MA200 (7135.98). Price is showing a modest pullback after previous gains, holding above the 60-day swing low of 7232.25. Immediate resistance is the MA20 at 7709.35, while support can be found at the session low of 7670.75, coinciding with a 38.2% Fibonacci retracement of the recent swing. The market remains in an uptrend but faces short-term overhead resistance. Bias: Neutral above 7670.75.
Dow futures (YM) YM futures are at 53513.00, trading below the MA20 (53607.90) but above the MA50 (52927.08) and MA200 (49793.94), suggesting a minor retracement in an otherwise bullish structure. The index is attempting to stabilize after touching the session low of 53435.00. Key resistance is at the MA20, while support is found at 53435.00 and then the 38.2% Fibonacci retracement of the 60-day swing at 53123.00. A rebound from current levels could target the prior high of 53778.00. Bias: Neutral below 53607.90.
DAX DAX is trading at 26285.96, marginally higher today and above its MA20 (26157.69), MA50 (25523.27), and MA200 (24586.55), indicating a strong bullish trend. Price is currently testing the 60-day swing high of 26573.50, demonstrating resilience. The session high of 26466.76 acts as immediate resistance. Support is established at the MA20 and the session low of 26196.92. A break above the swing high could target 127.2% Fibonacci extension at 27000.00. Bias: Bullish above 26196.92.
FTSE 100 FTSE 100 is at 10878.12, trading above all key moving averages (MA20: 10829.88, MA50: 10675.51, MA200: 10322.35), reinforcing a clear bullish trend. The index is consolidating below its 60-day swing high of 10989.50. Resistance lies at the session high of 10920.48. Support is found at the MA20 and the session low of 10855.62. A sustained move above 10920.48 targets the swing high. Bias: Bullish above 10855.62.
COMMODITIES Spot gold (XAU/USD) Spot gold is trading higher at 4653.00, well above its MA20 (4367.50), MA50 (4201.92), and MA200 (4508.79), confirming a strong uptrend. Price has printed a new 60-day swing high today at 4730.90, indicating robust buying interest. Immediate resistance is the daily high, with further upside targeting the 127.2% Fibonacci extension at 4967.00. Support is at the previous swing high of 4730.90 (now acting as support if sustained) and the MA200 at 4508.79. Bias: Bullish above 4639.80.
Spot silver (XAG/USD) Spot silver is down at 68.015, trading above MA20 (64.239) and MA50 (61.711) but below the MA200 (71.361), suggesting a mixed long-term picture with short-term strength. The metal has retraced from the session high of 69.750, finding support near the 38.2% Fibonacci retracement of the 60-day swing at 66.079. Resistance is at the MA200 at 71.361, while support is the session low of 67.500. Bias: Neutral below 69.750.
Copper Copper is trading at 6.70250, above all key moving averages (MA20: 6.57970, MA50: 6.38330, MA200: 5.93220), indicating a firm bullish trend. The metal is consolidating below its 60-day swing high of 6.87950, which also serves as the session high. Support is at the session low of 6.68850, followed by the MA20. A break above 6.87950 would target new highs and activate 127.2% Fibonacci extension towards 7.1000. Bias: Bullish above 6.68850.
WTI crude WTI crude is trading higher at 82.580, positioned above its MA20 (82.371), MA50 (79.024), and MA200 (77.824), indicating bullish momentum. The price tested the session high of 83.310 earlier but has since pulled back. Immediate resistance is at this session high, with strong resistance at the 60-day swing high of 97.000. Support is at the MA20, followed by the session low of 79.620. Bias: Bullish above 82.371.
Brent crude Brent crude is lower at 87.280, trading below its MA20 (87.934) but above MA50 (83.984) and MA200 (82.821), signaling short-term weakness within a broader uptrend. The current price action is testing the 38.2% Fibonacci retracement of the 60-day swing at 87.590. Resistance is at the MA20, followed by the session high of 88.280. Support is the session low of 84.590, then the MA50. Bias: Neutral below 87.934.
Natural gas Natural gas is showing significant strength, up over 5% at 2.91200, trading above its MA20 (2.75160) but below its MA50 (2.92950) and MA200 (3.36230). Price has broken above the day's open and is approaching the MA50 as a key resistance level. Immediate resistance is the session high of 2.92600, then the MA50 at 2.92950. Support is found at the MA20 and the session low of 2.83900. Bias: Bullish above 2.83900.
RATES US 10-year Treasury yield The US 10-year Treasury yield is higher at 4.66600, trading below its MA20 (4.67980) but above MA50 (4.59050) and MA200 (4.33700), indicating a short-term consolidation within an underlying uptrend. The yield is testing the MA20 as immediate resistance and is nearing the 60-day swing high of 4.74700. Support is at the session low of 4.62100, then the MA50. Bias: Neutral above 4.62100.
CRYPTO Bitcoin (BTC/USDT) Bitcoin is consolidating at 78461.3, below its opening price and prior close, indicating mild selling pressure within the session range of 77632.58-79380. The price action suggests indecision, with the current level near the middle of the daily range. Resistance is at the session high of 79380, and psychological 80000. Support is the session low of 77632.58. Bias: Neutral below 79380.
Ethereum (ETH/USDT) Ethereum is trading at 2461.99, slightly below its open, showing a modest pullback within the session range of 2414.64-2475.61. The current price is near the day's high but has failed to sustain above the prior close. Resistance is at the session high of 2475.61. Support is the session low of 2414.64, which needs to hold to prevent further downside. Bias: Neutral below 2475.61.
Solana (SOL/USDT) Solana is lower at 97.01, extending its previous session's decline and trading below its opening price. The session range is 94.95-98.83, indicating active selling pressure pushing price towards the lower bound. Resistance is at the session high of 98.83 and the prior close of 98.11. Support is at the session low of 94.95. Bias: Bearish below 98.11.
LONDON OPEN WATCH: Dollar strength across the DXY at 99.155 and a firm US 10-year yield at 4.66600 may exert pressure on risk assets. Watch for key support levels in NQ (29096.00) and ES (7670.75) to hold, while gold (4653.00) remains bullish and natural gas (2.91200) shows breakout potential against its MA50.