
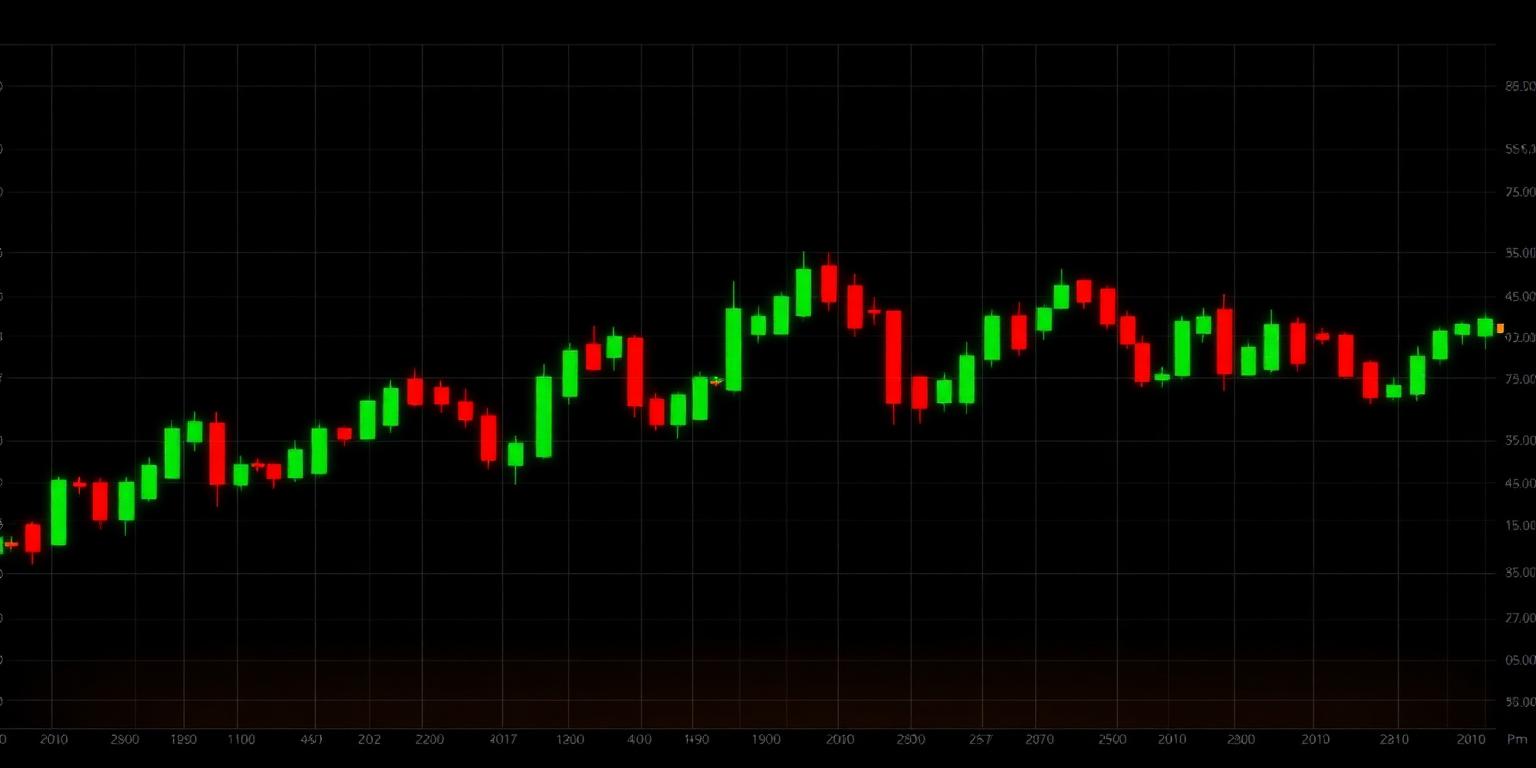
FOREX EUR/USD The pair trades below its MA20 and MA200, indicating short-term weakness, though above its MA50. The current price at 1.16170 is holding near the session low of 1.16090. Resistance emerges at the MA200 at 1.16330 and the 61.8% Fibonacci retracement of the 60-day swing (1.13254-1.17123) at 1.15655 provides a key support level. Daily pivot resistance at 1.16200, 1.16370. Bias: Neutral, invalidation above 1.16330.
GBP/USD GBP/USD is trading at 1.35190, below its MA20 but above its MA50 and MA200, suggesting a mixed short-term outlook within a broader uptrend. The 60-day swing low of 1.31430 to high of 1.36750 places 38.2% Fibonacci support at 1.34700. Daily pivot support is at 1.35180, 1.35040. Resistance lies at the MA20 at 1.35580 and the 50% Fibonacci retracement at 1.34090. Bias: Neutral, invalidation below 1.34700.
USD/JPY USD/JPY is trading at 155.835, significantly below all key moving averages (MA20: 158.939, MA50: 160.512, MA200: 158.453), confirming a strong downtrend. The pair found support near the 60-day swing low of 155.256. The 38.2% Fibonacci retracement of the 60-day swing (155.256-163.979) stands at 160.655, acting as overhead resistance. Daily pivot resistance at 156.090, 156.520. Bias: Bearish, invalidation above 158.453.
AUD/USD AUD/USD is trading at 0.72130, above its MA20, MA50, and MA200, indicating a clear short-term uptrend. The current price is at the session high and near the 60-day swing high of 0.72160, signaling potential resistance. A break above 0.72160 could target the 127.2% Fibonacci extension at 0.73070. Daily pivot resistance at 0.72080, 0.72140. Bias: Bullish, invalidation below 0.71350.
US Dollar Index (DXY) DXY trades slightly lower at 99.154, positioned below its MA20 and MA50, but marginally above its MA200. This suggests a weakening short-term trend within a range-bound context. The 60-day swing high/low of 101.800/98.560 places the 50% retracement at 100.180, near the MA50, acting as a critical resistance. Support is observed near 99.00 and the 38.2% Fibonacci retracement at 99.780. Bias: Neutral-to-bearish, invalidation above 99.360.
INDICES AND FUTURES Nasdaq 100 futures (NQ) NQ is flat at 29565.25, hovering just above its MA20 at 29551.60 and significantly above its MA50 and MA200, indicating an uptrend. The prior session close and current price are identical, suggesting consolidation. The 60-day swing high of 30968.00 remains the key target. Support is found at the MA20 and the prior session low of 29530.50. Bias: Bullish, invalidation below 29551.60.
S&P 500 futures (ES) ES trades at 7722.00, precisely on its MA20 and well above its MA50 and MA200, maintaining an uptrend structure. The 60-day swing high of 7838.50 is the next resistance. The low of the session 7709.75 offers immediate support. Daily pivot support at 7716.50, 7711.00. Bias: Bullish, invalidation below 7722.21.
Dow futures (YM) YM is flat at 53440.00, just below its MA20 at 53492.30 but above its MA50 and MA200. This suggests short-term consolidation after recent gains. The 60-day swing high of 54884.00 is the primary upside target. Immediate support is at the session low of 53188.00 and the MA50 at 53136.56. Bias: Bullish, invalidation below 53136.56.
DAX DAX is at 26046.40, below its MA20 but above its MA50 and MA200. The index is consolidating within its 60-day swing range (24547.70-26618.74). The MA20 at 26208.88 acts as immediate resistance. Support is at the MA50 at 25695.32. The daily pivot resistance at 26048.90, 26094.50. Bias: Neutral-to-bullish, invalidation below 25695.32.
FTSE 100 FTSE 100 is largely unchanged at 10831.09, trading above all key moving averages (MA20: 10808.20, MA50: 10719.59, MA200: 10353.75), indicating a strong uptrend. The index is near its 52-week high of 10989.50. The MA20 provides immediate dynamic support. The 60-day swing high of 10989.50 is the next resistance level. Bias: Bullish, invalidation below 10808.20.
COMMODITIES Spot gold (XAU/USD) Gold is trading at 4476.60, above its MA20 and MA50, but below its MA200, suggesting a short-term bullish bias within a longer-term neutral-to-bearish context. The current price is challenging the MA20 at 4472.90. Resistance at the 61.8% Fibonacci retracement of the 60-day swing (3962.50-4670.90) at 4505.70. Daily pivot resistance at 4475.20, 4520.60. Bias: Neutral-to-bullish, invalidation below 4429.80.
Spot silver (XAG/USD) Silver is at 66.748, trading above its MA20 and MA50, but significantly below its MA200, indicating short-term momentum in a longer-term bearish trend. The price is challenging the MA20 at 66.520. Resistance is found at the 61.8% Fibonacci retracement of the 60-day swing (55.015-71.160) at 65.080, and then at the 71.160 swing high. Daily pivot resistance at 66.720, 67.000. Bias: Bullish, invalidation below 66.047.
Copper Copper is trading at 6.68250, above all key moving averages (MA20: 6.57620, MA50: 6.43330, MA200: 5.99340), signaling a strong uptrend. The current price is at the session high and nearing the 60-day swing high of 6.75000, which will act as strong resistance. The 127.2% Fibonacci extension from the 60-day swing is at 6.90100. Bias: Bullish, invalidation below 6.57620.
WTI crude WTI crude is flat at 91.480, trading above all key moving averages, reinforcing a strong uptrend. The price is near the 60-day swing high of 93.500. Immediate support is found at the MA20 at 85.903. A break above 93.500 could target the 127.2% Fibonacci extension at 100.420. Daily pivot resistance at 91.950, 92.420. Bias: Bullish, invalidation below 85.903.
Brent crude Brent crude is flat at 96.280, comfortably above all key moving averages (MA20: 91.581, MA50: 86.666, MA200: 84.002), confirming a robust uptrend. The price is testing the 60-day swing high of 102.010. The MA20 provides strong dynamic support. Daily pivot resistance at 96.790, 97.300. Bias: Bullish, invalidation below 91.581.
Natural gas Natural gas is flat at 2.97500, above its MA20 and MA50 but below its MA200, indicating short-term strength within a longer-term bearish trend. The 60-day swing high of 3.44100 is a key resistance level. The MA200 at 3.30080 also acts as significant overhead resistance. Daily pivot resistance at 2.980, 3.000. Bias: Neutral-to-bullish, invalidation below 2.83320.
RATES US 10-year Treasury yield The US 10-year yield is at 4.78400, above all key moving averages (MA20: 4.71070, MA50: 4.63340, MA200: 4.35960), suggesting a strong bullish trend in yields. The current level is approaching the 60-day swing high and 52-week high of 4.81200. This indicates continued upward pressure on rates. The MA20 acts as immediate support. Bias: Bullish, invalidation below 4.71070.
LONDON OPEN WATCH: Expect focus on DXY's continued retreat, potentially offering EUR/USD and GBP/USD room for mild recovery from current lows. Commodities, particularly metals and crude, show broad strength, suggesting risk-on sentiment in the raw materials complex which could extend into European trading hours.