
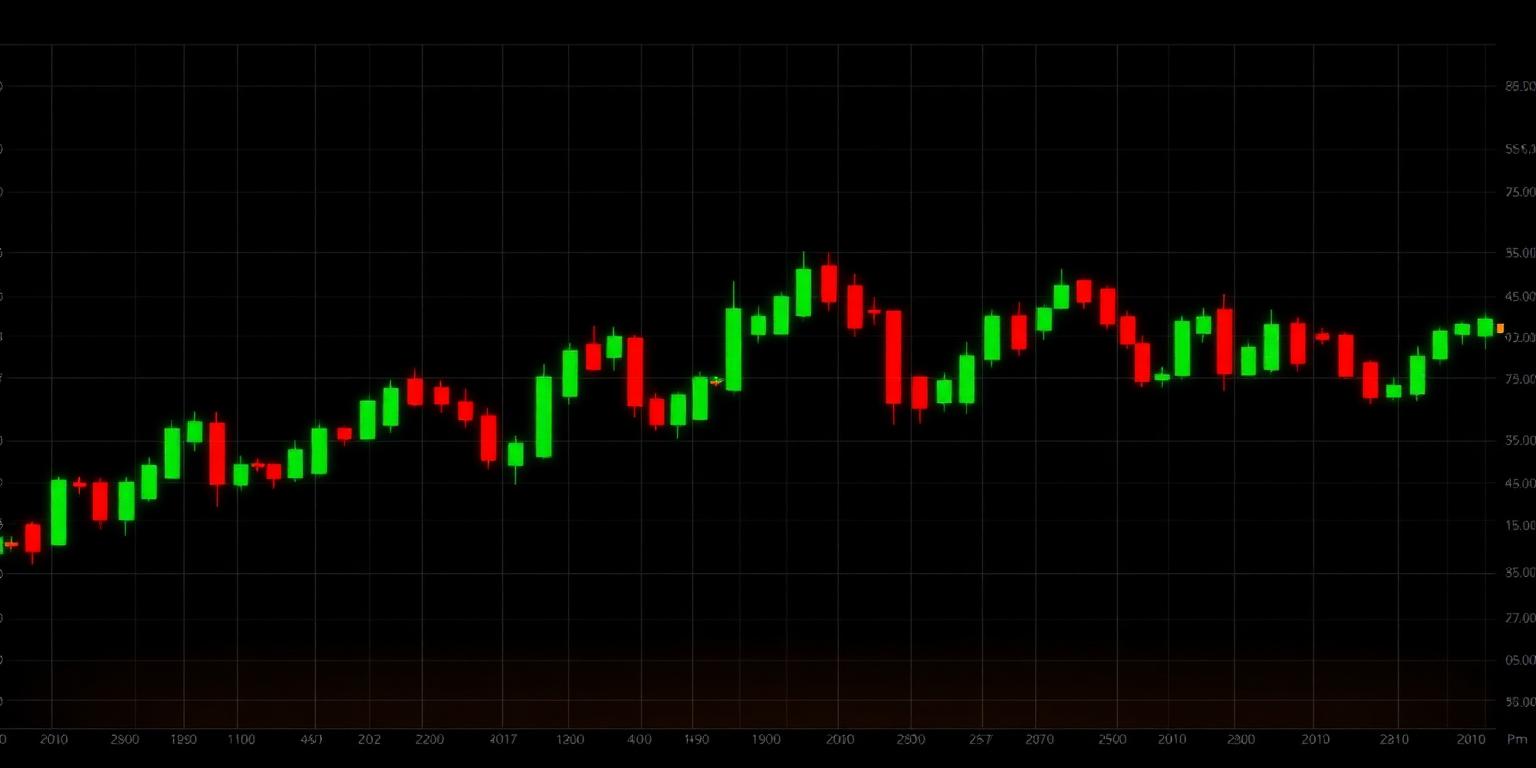
FOREX EUR/USD EUR/USD trades above its 200-period MA at 1.16330, consolidating recent gains. The current level of 1.16350 is at the session high and holds above the 20-period MA at 1.16150. Immediate resistance is the session high of 1.16370, with the 60-day swing high at 1.17123 a broader target. Support lies at the prior close of 1.16140 and the session low of 1.16270. A Fibonacci retracement from the 60-day swing high (1.17123) to low (1.13254) places the 38.2% level at 1.14725, suggesting current prices are well above this. The pair's ATR14 is 0.00330, indicating moderate volatility. Bias: Bullish above 1.16140.
GBP/USD GBP/USD shows upward momentum, trading at 1.35440, above its 50-period MA at 1.34620 and 200-period MA at 1.34450. However, it remains below the 20-period MA at 1.35600. The session high of 1.35500 acts as immediate resistance. Support is found at the previous close of 1.35172, with the session low at 1.35340 holding intra-day. The 60-day swing high is 1.36750, while the 60-day swing low is 1.31430. The 38.2% Fibonacci retracement from the 60-day high-to-low is at 1.33440, well below current levels. Bias: Neutral-to-Bullish above 1.35172.
USD/JPY USD/JPY has plunged significantly, currently at 153.313, marking a sharp drop from the previous close of 156.197. All key moving averages (MA20 158.665, MA50 160.347, MA200 158.440) are well above the current price, confirming strong bearish momentum. The session low of 152.881 is also the 60-day swing low, indicating critical support. Resistance is the session high of 154.374 and the previous close. The ATR14 is high at 1.198, reflecting increased volatility. Bias: Bearish below 154.374.
AUD/USD AUD/USD trades at 0.72210, maintaining gains and at its 60-day swing high of 0.72260. The pair is well above all major MAs (MA20 0.71430, MA50 0.70460, MA200 0.69880), indicating a strong uptrend. Immediate resistance is the session high of 0.72260, which also matches the 60-day swing high, suggesting a potential breakout or resistance point. Support comes from the previous close of 0.72064 and the session low of 0.72090. The 38.2% Fibonacci extension from the 60-day swing high-to-low points to further upside if 0.72260 is cleared. Bias: Bullish above 0.72064.
US Dollar Index (DXY) The DXY is trading lower at 98.806, down -0.36%, reflecting broad USD weakness. It is currently below its MA20 (99.343), MA50 (100.184), and MA200 (99.162), indicating bearish pressure. Immediate support is the session low at 98.724, nearing the 60-day swing low of 98.560. Resistance is the previous close of 99.160. The ATR14 of 0.362 suggests moderate volatility. Bias: Bearish below 99.160.
INDICES AND FUTURES Nasdaq 100 futures (NQ) NQ futures trade at 29639.00, slightly positive. The price is above its MA20 (29555.29) and MA50 (29375.32), indicating a short-to-medium term bullish bias. However, it remains below the 60-day swing high of 30968.00. Immediate resistance is the session high of 29764.75. Support is found at the previous close of 29565.25 and the session low of 29525.00. The ATR14 is 376.18, signaling decent volatility. Bias: Bullish above 29565.25.
S&P 500 futures (ES) ES futures are trading at 7710.25, slightly negative. The price sits below its MA20 (7721.63) but above its MA50 (7628.63) and MA200 (7173.32). Immediate resistance is the previous close of 7722.00, aligning closely with the MA20. Support lies at the session low of 7698.25. The 60-day swing high is 7838.50, with the 60-day swing low at 7324.00. The 38.2% Fibonacci retracement from the high-to-low is at 7644.80. Bias: Neutral-to-Bearish below 7722.00.
Dow futures (YM) YM futures are down at 53058.00, below the previous close of 53440.00 and all key moving averages (MA20 53473.20, MA50 53128.92). The session low of 53036.00 provides immediate support. The next key support level is the 60-day swing low of 50836.00. Resistance is the session high of 53336.00 and the MA50 at 53128.92. The ATR14 is 493.36, indicating high volatility. Bias: Bearish below 53128.92.
DAX DAX is trading at 26006.53, slightly negative. The index is currently below its MA20 (26193.01) but above its MA50 (25722.91) and MA200 (24680.45). Immediate resistance is the previous close of 26046.40, with the session high at 26069.99. Support is found at the session low of 25919.61. The 60-day swing high is 26618.74. The 38.2% Fibonacci retracement from the 60-day high (26618.74) to low (24547.70) is at 25345.92. Bias: Neutral-to-Bearish below 26046.40.
FTSE 100 FTSE 100 is trading marginally lower at 10822.13. The index is above its MA20 (10804.25), MA50 (10725.87), and MA200 (10360.32), maintaining an upward trend. Immediate support is the MA20 at 10804.25 and the session low of 10794.17. Resistance is the previous close of 10831.10 and the session high of 10868.27. The 60-day swing high is 10989.50. Bias: Bullish above 10804.25.
COMMODITIES Spot gold (XAU/USD) Spot gold is trading higher at 4470.40, crossing above its 20-period MA at 4472.59 during the session. The price is well above its MA50 (4246.82) but remains below its MA200 (4522.51), suggesting a mixed long-term picture. Immediate resistance is the session high of 4488.80, with the 200-period MA as the next key level. Support is the previous close of 4429.80 and the session low of 4426.20. The 38.2% Fibonacci retracement from the 60-day swing high (4670.90) to low (3962.50) is at 4235.94. Bias: Bullish above 4429.80.
Spot silver (XAG/USD) Spot silver is posting strong gains at 67.355, trading above its MA20 (66.550) and MA50 (62.158). It remains significantly below its MA200 (71.988). Immediate resistance is the session high of 67.835. Support is the MA20 at 66.550 and the previous close of 66.047. The 60-day swing high is 71.160. The 38.2% Fibonacci retracement from the 60-day high-to-low (55.015) is at 60.910. Bias: Bullish above 66.550.
Copper Copper is trading strongly higher at 6.77600, significantly above all key moving averages (MA20 6.58090, MA50 6.43520, MA200 5.99390). The current price is near the session high of 6.81000, which also matches the 60-day swing high, indicating a potential breakout into new highs for the 60-day period. Immediate support is the previous close of 6.59700. The ATR14 is 0.07740, suggesting rising volatility with the upward move. Bias: Strongly Bullish above 6.70000.
WTI crude WTI crude is rallying at 93.390, above all major moving averages (MA20 85.999, MA50 81.440, MA200 78.978), confirming a strong uptrend. The current price is near the session high of 93.610, which matches the 60-day swing high, implying a test of recent peaks. Immediate support is the previous close of 91.480. The ATR14 is 3.231, indicating high volatility. A breakout above 93.610 would be a significant bullish signal. Bias: Bullish above 92.000.
Brent crude Brent crude is also showing strength at 98.050, trading above its MA20 (91.669), MA50 (86.701), and MA200 (84.011), confirming robust bullish momentum. The price is approaching the session high of 98.230. Resistance beyond that is the 60-day swing high of 102.010. Support is the previous close of 96.280. The ATR14 is 3.269, indicating high volatility. Bias: Bullish above 97.000.
Natural gas Natural gas is trading slightly lower at 2.95800, below its previous close of 2.97500. The price is currently above its MA20 (2.83240) and MA50 (2.88060) but well below its MA200 (3.30070). Immediate support is the session low of 2.92100. Resistance is the previous close of 2.97500 and the session high of 2.99800. The 38.2% Fibonacci retracement from the 60-day high (3.44100) to low (2.61600) is at 2.930. Bias: Neutral-to-Bearish below 2.97500.
RATES US 10-year Treasury yield The US 10-year Treasury yield is at 4.78400, up slightly. It trades above all key moving averages (MA20 4.71070, MA50 4.63340, MA200 4.35960), suggesting continued upward pressure. The current level is approaching the 60-day swing high and 52-week high of 4.81200. Immediate resistance is this 4.81200 level. Support is the previous close of 4.76200. The ATR14 is 0.04570, indicating moderate volatility. Bias: Bullish above 4.76200.
LONDON OPEN WATCH: Equity futures show mixed sentiment with NQ positive and ES/YM negative, while the DXY is under pressure from a strong JPY sell-off. Key levels to watch include the 60-day swing highs for Copper and WTI, as breakouts could signal extended commodity strength, and USD/JPY for any bounce from its 60-day low.