
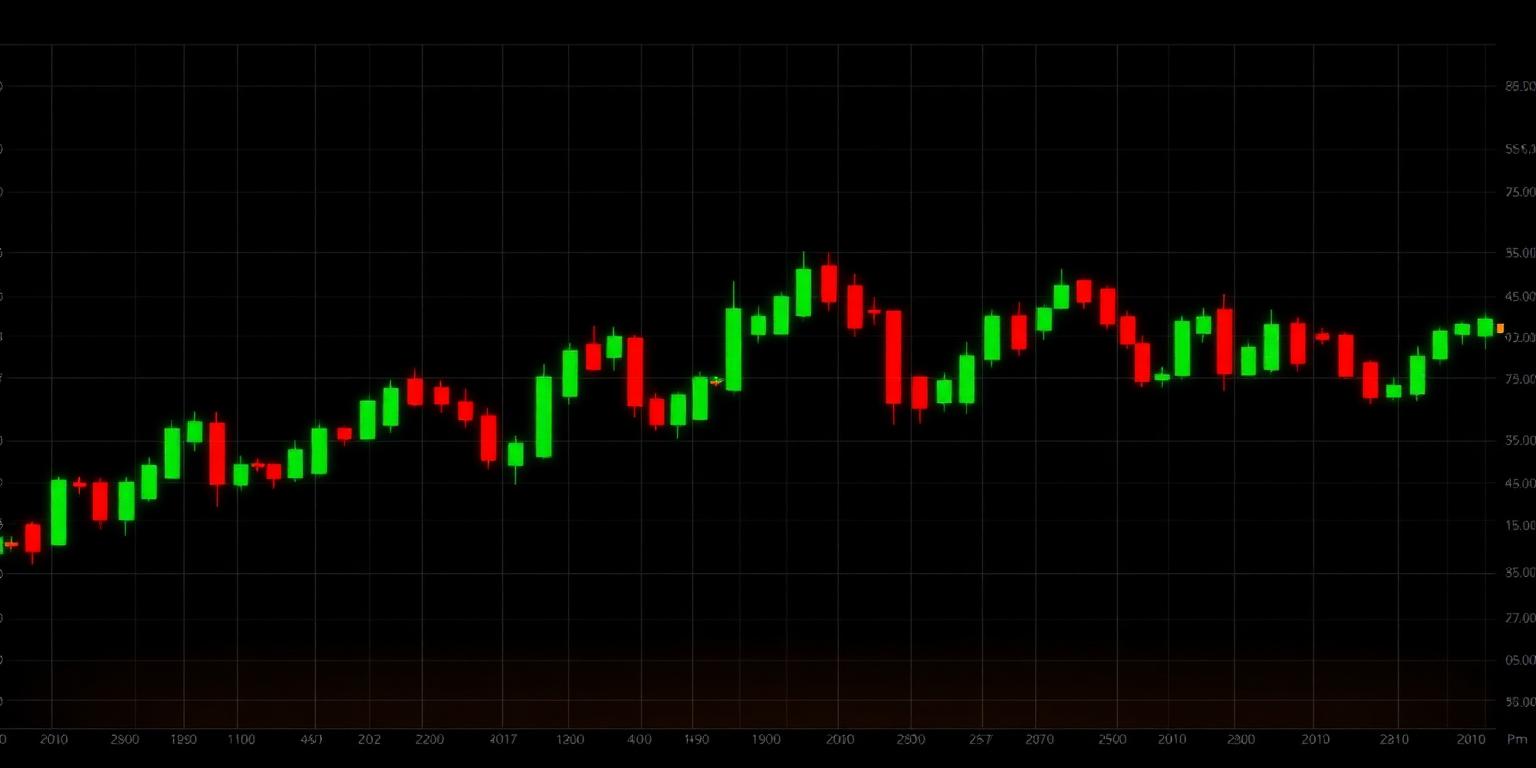
FOREX EUR/USD EUR/USD trades positively, currently above its MA20 at 1.16200 and MA200 at 1.16330, indicating a short-term bullish bias despite a slightly negative MA50 trend. The pair found support at the session low 1.16280, now targeting the session high 1.16400 as immediate resistance. A break above 1.16400 could open the path to the weekly R1 at 1.16500. Conversely, a retreat below the MA200 would target the daily pivot at 1.16280. Bias: Bullish above 1.16330.
GBP/USD GBP/USD shows modest gains, trading above its MA50 at 1.34690 and MA200 at 1.34470, but below its MA20 at 1.35620. The current price 1.35530 is near the session high 1.35550, suggesting an attempt to reclaim short-term momentum. Resistance lies at 1.35550, with a breach targeting the weekly R1 at 1.35700. Support is identified at the session low 1.35370, followed by the daily pivot at 1.35470. Bias: Neutral with bullish inclination above 1.35470.
USD/JPY USD/JPY is under pressure, trading well below all key moving averages (MA20 158.392, MA50 160.171, MA200 158.429), indicating a strong downtrend. The pair is near its 60-day swing low 152.897, with the current price 153.276 reflecting significant weakness. The session range 153.228-153.974 highlights recent consolidation after a steep fall. Immediate support is at the session low 153.228, with a break potentially testing 152.897. Resistance is found at the daily pivot 153.610. Bias: Bearish below 153.610.
AUD/USD AUD/USD continues its upward trajectory, trading at 0.72330, near its 60-day swing high 0.72354 and above all three MAs (MA20 0.71510, MA50 0.70520, MA200 0.69910). This confirms a strong bullish trend with momentum. The current session high at 0.72350 serves as immediate resistance, with 0.72354 being a critical break point. Fibonacci extension at 0.72470 is the next target on a breakout. Support is at the daily pivot 0.72260, followed by the session low 0.72200. Bias: Bullish above 0.72260.
DXY The US Dollar Index (DXY) is trading lower at 98.736, below its MA20 (99.290), MA50 (100.137), and MA200 (99.155), maintaining a bearish posture. The current level is close to the 60-day swing low of 98.560, indicating potential further downside if this support fails. Immediate support is found at the session low 98.705 and then the critical 98.560. Resistance stands at the daily pivot 98.790 and the session high 98.821. Bias: Bearish below 98.790.
INDICES AND FUTURES Nasdaq 100 futures (NQ) NQ futures are marginally positive, currently at 29587.25, trading above MA50 (29364.01) and MA200 (27192.81) but struggling below MA20 (29548.34). The current level is pushing against the daily pivot at 29550.00, suggesting a balanced market sentiment. Immediate resistance is at the session high 29625.50. A break above this would target 29650.00, potentially followed by the weekly R1 at 29780.00. Support is at 29489.75. Bias: Neutral with bullish bias above 29550.00.
S&P 500 futures (ES) ES futures show modest gains, trading at 7687.75, above MA50 (7631.78) and MA200 (7178.30) but below MA20 (7717.15). This indicates a potential struggle for sustained upside momentum. Immediate resistance is at the session high 7689.75, with the daily R1 at 7695.00 a key level to watch. Support is at the daily pivot 7684.00, and then the session low 7672.75. Bias: Neutral with bearish inclination below 7700.00.
Dow futures (YM) YM futures are flat, currently at 52837.00, hovering slightly above its previous close. The index remains below its MA20 (53409.75), MA50 (53129.70), and MA200 (50066.33), suggesting underlying weakness. The current price is near the daily pivot 52812.00, highlighting consolidation. Session high 52837.00 serves as immediate resistance, with the weekly R1 at 53040.00 further up. Support is at the session low 52767.00. Bias: Bearish below 52812.00.
DAX DAX is trading sideways at 26007.63, near its previous close, and below its MA20 (26173.82) but above its MA50 (25743.15). The session range 25799.66-26026.78 points to a period of consolidation. Immediate resistance is at the session high 26026.78, with the daily R1 at 26100.00 as the next target. Support is at the daily pivot 25940.00 and the session low 25799.66. Bias: Neutral below 26026.78.
FTSE 100 FTSE 100 is down slightly at 10811.66, trading just above its MA20 (10801.71) and MA50 (10732.42). The index is showing signs of weakness after rejecting the session high 10850.73. Immediate support is at the daily pivot 10815.00, with a break targeting the MA20. Resistance is at the session high 10850.73, followed by the weekly R1 at 10880.00. Bias: Neutral with bearish inclination below 10815.00.
COMMODITIES Spot gold (XAU/USD) Spot gold is up over 1%, trading at 4440.00, near the session high 4440.70. Gold is currently above its MA50 (4253.64) but below MA20 (4471.61) and MA200 (4523.94), suggesting a battle between short-term momentum and longer-term bearishness. The current rally targets the MA20 at 4471.61 as next resistance. Support is at the daily pivot 4406.00 and session low 4384.10. Bias: Neutral with bullish bias above 4406.00.
Spot silver (XAG/USD) Spot silver shows strong gains, up 1.38% at 67.210, near its session high 67.310. Silver is trading above its MA20 (66.619) and MA50 (62.317) but significantly below its MA200 (72.065). The current price action indicates a strong bullish impulse, targeting the daily R1 at 67.500. Further resistance is at the weekly R1 68.000. Support is at the daily pivot 66.580 and MA20 at 66.619. Bias: Bullish above 66.619.
Copper Copper is advancing, up 0.39% at 6.76500, near its 60-day swing high and session high of 6.80200. The metal is trading above all three key moving averages (MA20 6.58670, MA50 6.44780, MA200 6.00250), confirming a robust uptrend. A break above 6.80200 would indicate a fresh bullish breakout. Immediate resistance is 6.80200. Support is at the daily pivot 6.75000 and the weekly pivot 6.70000. Bias: Bullish above 6.75000.
WTI crude WTI crude is gaining momentum, up 0.87% at 93.840, near the session low 93.760. It is trading significantly above all major moving averages (MA20 86.513, MA50 81.895, MA200 79.148), indicating a strong uptrend. The 60-day swing high at 94.780 is the next critical resistance. A break above this level would signal further upside. Support is at the daily pivot 93.870 and the weekly pivot 92.500. Bias: Bullish above 93.870.
Brent crude Brent crude is also showing strength, up 0.99% at 98.890. Similar to WTI, it trades well above all key moving averages (MA20 92.162, MA50 87.213, MA200 84.188), confirming a strong bullish trend. The session high 99.670 is the immediate resistance, with the weekly R1 at 100.000 as the next target. Support is at the daily pivot 98.830 and the session low 98.830. Bias: Bullish above 98.830.
Natural gas Natural gas is declining, down 1.10% at 2.88400, trading below its previous close and MA20 (2.83610) but above MA50 (2.87380). The current price is near the MA50, which could act as dynamic support. Immediate support is at the session low 2.87800, with a break potentially targeting the weekly pivot 2.85000. Resistance is at the daily pivot 2.90000 and session high 2.90700. Bias: Neutral with bearish inclination below 2.90000.
RATES US 10-year Treasury yield The US 10-year Treasury yield is up 0.46% at 4.80600, trading near its 60-day swing high and 52-week high of 4.81200. The yield is above all moving averages (MA20 4.71600, MA50 4.64210, MA200 4.36300), indicating strong upward momentum. A break above 4.81200 would signal new highs and further hawkish sentiment. Support is at the daily pivot 4.79800. Bias: Bullish above 4.79800.
LONDON OPEN WATCH: Key levels to watch into the London open include the Nasdaq 100 futures resistance at 29625.50 and S&P 500 futures resistance at 7689.75, as equities struggle to break higher. In FX, DXY's test of its 60-day swing low 98.560 and AUD/USD's attempt to break its 60-day swing high 0.72354 will dictate short-term currency dynamics.