
Investors and traders brace for JOLTS US labor market data,CB Consumer confidence to see the health off the US consumer and fed speakers today , Brent crude oil the worlds benchmark and WTI west Texan intermediate US oil down on the day .
FOREX
EUR/USD
EUR/USD trades below its prior close and remains pressured near session lows. The pair is firmly bearish, with price well below the downward-sloping MA20 (1.15220), MA50 (1.15360), and MA200 (1.16190). Current price 1.13610 is testing the 60-day swing low of 1.13543, indicating a potential break lower. A break below this level could target the 52-week low of 1.13250.
Bias: Bearish. Invalidated above 1.13780 (prior close).
GBP/USD GBP/USD shows modest gains but remains within a tight session range. Price 1.32340 is below all key moving averages (MA20 1.34230, MA50 1.34640, MA200 1.34500), indicating a strong downtrend. The pair is hovering near its 60-day swing low of 1.32100, suggesting further downside risk if this support breaks. Immediate resistance is at the session high 1.32590. Bias: Bearish. Invalidated above 1.32590 (session high).
USD/JPY USD/JPY retreats slightly but holds above the MA20 (156.265). Price 157.301 is trading below the MA50 (158.500) and MA200 (158.476), suggesting a struggle for sustained bullish momentum after recent highs. The 60-day swing high is 163.979, with support near the 157.199 session low. The ATR14 of 1.073 indicates significant volatility. Bias: Neutral. Invalidated above 157.585 (session high).
AUD/USD AUD/USD is trading lower, pushing towards the session low 0.69840. The pair is in a clear downtrend, with price 0.69890 well below the MA20 (0.71270), MA50 (0.70930), and MA200 (0.70240). Current levels are testing the 60-day swing low at 0.69137. Breaking below the session low could signal further bearish momentum towards the 52-week low of 0.64220. Bias: Bearish. Invalidated above 0.70091 (prior close).
US Dollar Index (DXY) DXY registers marginal gains, pushing towards its session high of 101.328. Price 101.323 is trading well above its MA20 (99.999), MA50 (99.966), and MA200 (99.221), confirming a strong bullish trend. The index is nearing its 60-day swing high of 101.640, indicating potential for further strength and exerting pressure on major currency pairs. The immediate support is the prior close at 101.200. Bias: Bullish. Invalidated below 101.200 (prior close).
INDICES AND FUTURES Nasdaq 100 futures (NQ) NQ futures are pulling back from the prior close, trading at 30427.25. While MA20 (29813.51), MA50 (29465.23), and MA200 (27519.39) all point to an uptrend, current price is below the prior close and testing the lower end of the session range. The 60-day swing high at 31094.75 acts as strong resistance. Initial support lies at the session low 30372.25, with MA20 as a key level. Bias: Bullish. Invalidated below 30372.25 (session low).
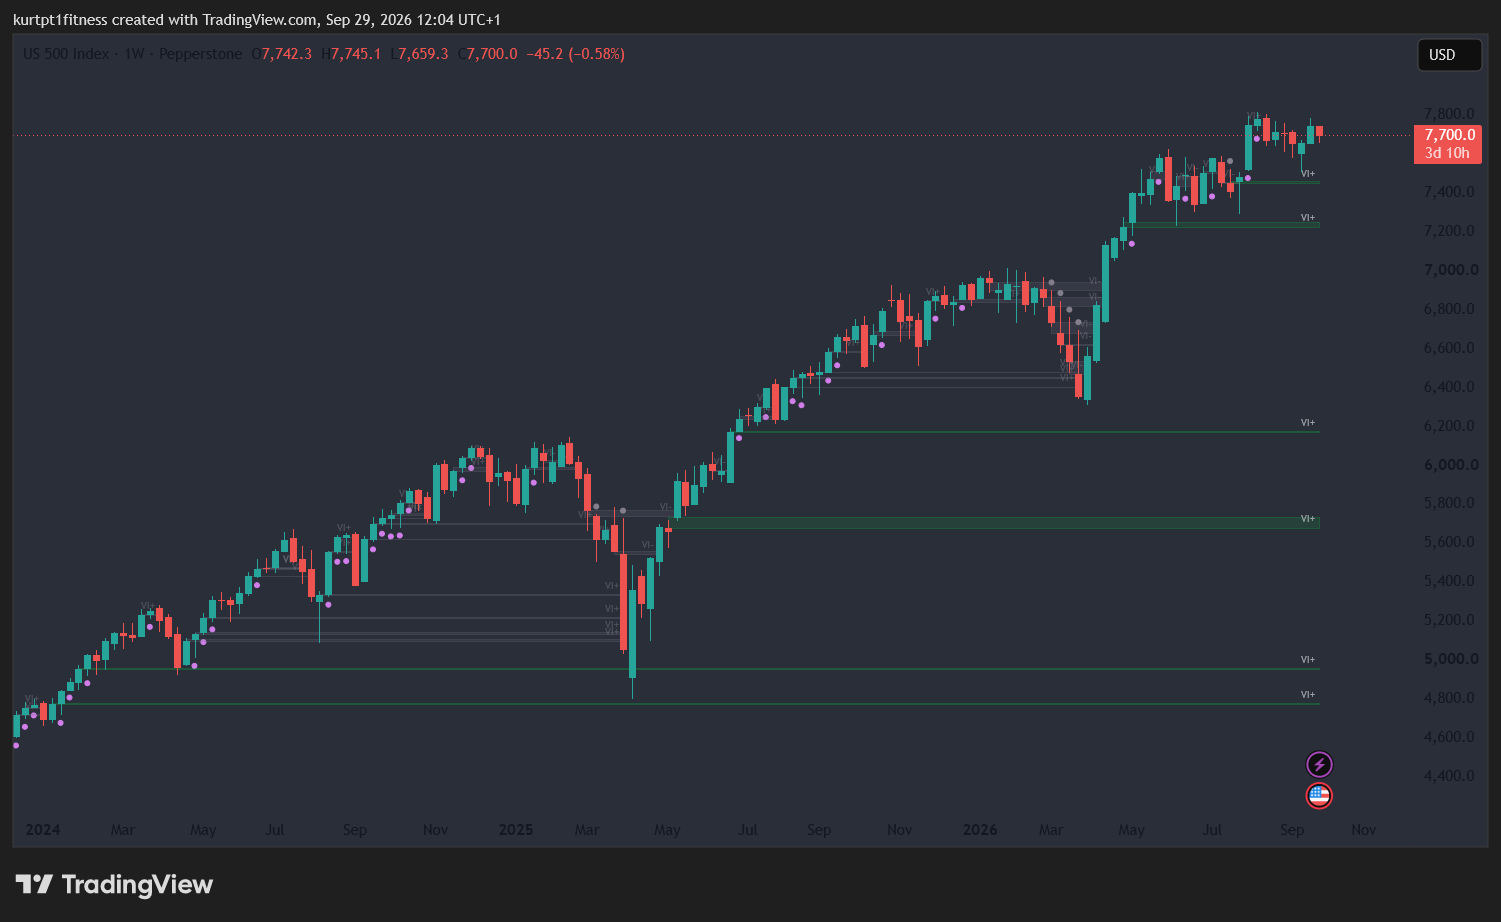
S&P 500 futures (ES) ES futures are showing a slight dip, trading at 7728.00. Price remains above the MA20 (7696.48), MA50 (7670.51), and MA200 (7240.94), maintaining a bullish bias. Current session activity is contained within the prior close 7746.75 and session low 7716.00. The 60-day swing high at 7848.50 is the next significant resistance. A break below MA20 could signal deeper retracement. Bias: Bullish. Invalidated below 7716.00 (session low).
Dow futures (YM) YM futures are trading lower at 51745.00, below their prior close. Price is currently below the MA20 (52339.50) and MA50 (52908.04) but above the MA200 (50389.51), suggesting a short-term weakening within a broader uptrend. The 60-day swing low of 51209.00 provides significant support. Resistance is found at the prior close 51837.00. Bias: Neutral. Invalidated below 51644.00 (session low).
DAX DAX is trading down at 25374.42, below its prior close and both the MA20 (25619.76) and MA50 (25821.17). This indicates short-term bearish pressure, despite being above the MA200 (24814.85). The session low at 25360.32 is immediate support, with the 60-day swing low 24651.34 as a critical downside target. The 25000 psychological level may offer interim support. Bias: Bearish. Invalidated above 25408.64 (prior close).
FTSE 100 FTSE 100 is down marginally at 10684.88, trading at its session low. Price is below its MA20 (10725.19) and MA50 (10769.65), but above the MA200 (10439.02), indicating short-term weakness in an overall uptrend. The 60-day swing low of 10397.50 is a key downside reference. The prior close 10695.30 acts as immediate resistance. Bias: Neutral. Invalidated above 10695.30 (prior close).
COMMODITIES Spot gold (XAU/USD) Spot gold is experiencing a significant drop, down 3.54% at 4168.30. Price is now trading well below MA20 (4389.40), MA50 (4357.54), and MA200 (4555.72), confirming a strong bearish trend. The current price is near the session low of 4145.20, with the 60-day swing low of 3963.00 as the next major support. The previous close 4321.20 is now key resistance. Bias: Bearish. Invalidated above 4171.80 (session high).
Spot silver (XAG/USD) Spot silver is also trading lower at 61.040, below its prior close. Price is substantially below its MA20 (64.730), MA50 (63.819), and MA200 (72.665), signaling a firm downtrend. The 60-day swing low at 55.015 is the next significant support level. The session low 60.630 provides immediate support. Bias: Bearish. Invalidated above 61.245 (session high).
Copper Copper is up 0.95% at 6.62850, trading near its session high. Price is above the MA20 (6.58620) and MA50 (6.54950), and well above the MA200 (6.10040), indicating a positive momentum and bullish trend. The next resistance is the 60-day swing high of 6.83000. Immediate support is the prior close 6.56600. Bias: Bullish. Invalidated below 6.60650 (session low).
WTI crude WTI crude is higher by 1.63% at 94.110. Price is currently above MA50 (88.461) and MA200 (81.895) but below MA20 (96.187), indicating a mixed short-term trend within a broader uptrend. Resistance is at the session high 94.740 and then MA20. Support lies at the prior close 92.600 and session low 93.000. Bias: Neutral. Invalidated below 93.000 (session low).
Brent crude Brent crude has seen a significant sell-off, down 5.32% at 99.680. Price is now below its MA20 (102.047), but still above MA50 (94.309) and MA200 (87.097), suggesting a short-term bearish reversal within a broader uptrend. The current price is near the session low 98.430. The next key support is the MA50 at 94.309. Bias: Bearish. Invalidated above 100.290 (session high).
Natural gas Natural gas is up sharply by 4.17% at 3.12500, trading near its session high. Price is above its MA20 (2.95560) and MA50 (2.85070), indicating renewed bullish momentum. However, it remains just below the MA200 (3.16680), which could act as immediate resistance. The 60-day swing high 3.35500 is the next significant target. Bias: Bullish. Invalidated below 3.12000 (session low).
RATES US 10-year Treasury yield The US 10-year Treasury yield is higher at 5.24000, continuing its upward trajectory. The yield is trading above MA20 (4.94980), MA50 (4.78230), and MA200 (4.42840), confirming a strong bullish trend. It is approaching its 60-day and 52-week high of 5.27400, indicating significant upward pressure. The ATR14 of 0.06520 suggests continued volatility. Bias: Bullish. Invalidated below 5.18400 (prior close).
CRYPTO Bitcoin (BTC/USDT) Bitcoin shows modest gains, trading at 83453.80, above its prior close 83146.90. The 24-hour range of 82556.60-84374.20 indicates recent consolidation. With MA and RSI data unavailable, the current move is assessed primarily on price action, suggesting a slight short-term bullish tilt. Initial resistance is at the session high 84374.20. (Source: okx) Bias: Neutral. Invalidated below 82556.60 (session low).
Ethereum (ETH/USDT) Ethereum is up 1.06% at 2677.79, pushing higher from its prior close of 2649.79. The 24-hour range of 2637.29-2720.81 shows some upward momentum. Lacking MA and RSI data, the immediate price action suggests a short-term bullish bias. Resistance is at the session high 2720.81. (Source: okx) Bias: Neutral. Invalidated below 2637.29 (session low).
Solana (SOL/USDT) Solana is trading lower by 0.55% at 118.37, below its prior close 119.03. The 24-hour range of 116.37-120.75 highlights current choppiness. Without MA or RSI data, price action indicates short-term weakness, with immediate support at the session low 116.37. Resistance is at the prior close. (Source: okx) Bias: Neutral. Invalidated above 119.03 (prior close).
Equities face a mixed open with NQ and ES showing resilience above MAs, while DAX and FTSE are under short-term pressure. Precious metals are firmly bearish following gold's significant drop, while rising US 10-year yields support DXY strength.