
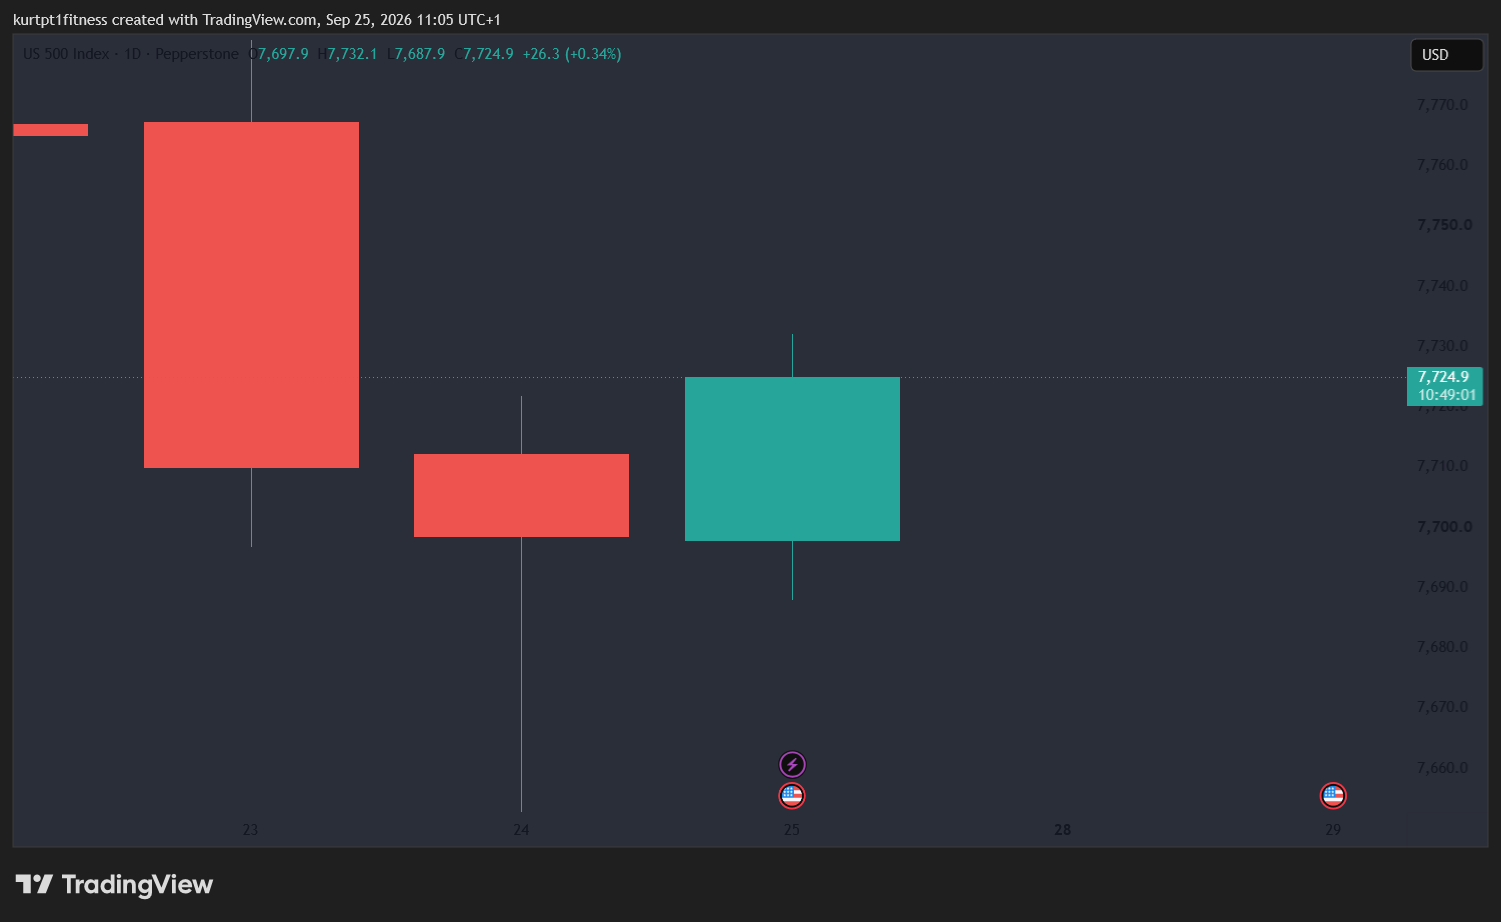
Peace talks in the middle east oil down and the stock market a touch up with that, bloomberg reported previous peace talks would move oil down around 6 % but now its only around a 2% move down for oil on optimism on peace with the war in iran . Today on the macro economic data side we have durable goods order .
FOREX DXY is trading slightly lower at 101.220 after holding above the session low of 101.209. The index is maintaining its posture above the 200-day MA of 99.192 but has pulled back from the 60-day swing high of 101.640. Current price sits above its 20-day MA of 99.770 and 50-day MA of 99.958, suggesting a short-term bullish bias within a broader range. Immediate support is at 101.209, with resistance at 101.305. Bias: Bullish above 101.209
EUR/USD is testing session lows at 1.13790, trading below its previous close of 1.13819. The pair is significantly below its MA20, MA50, and MA200, which are all declining, indicating a strong downtrend. The 60-day swing low of 1.13545 is the next critical support level. A Fibonacci 38.2 retracement from the 60-day swing high (1.17123) to the 60-day swing low (1.13545) would be near 1.1491, well above current price, suggesting further downside potential. Bias: Bearish below 1.13860
GBP/USD continues its downward momentum, trading at 1.32180, near its 60-day swing low of 1.32102. All key moving averages (MA20, MA50, MA200) are positioned above the current price and declining, reinforcing the strong bearish trend. The session low of 1.32100 is critical immediate support, a break below which could target the 52-week low of 1.30120. ATR14 at 0.00480 suggests moderate volatility. Bias: Bearish below 1.32230
USD/JPY is trading flat at 158.184, slightly below its previous close, and within a tight session range. The pair is hovering around its MA50 (158.692) and MA200 (158.455), indicating a consolidation phase. The 60-day swing low at 152.897 provides a strong support base, while the 60-day swing high at 163.979 remains a distant resistance. Current price is below its MA50, suggesting short-term weakness against a longer-term bullish trend. Bias: Neutral-to-bearish below 158.455
AUD/USD is showing weakness, trading at its session low of 0.70210, below its previous close. The pair is positioned below its MA20 (0.71450) and MA50 (0.70930), but is sitting right on its MA200 (0.70200). A break below the MA200 would signal further downside potential toward the 60-day swing low of 0.69073. Resistance is at the session high of 0.70210, with MA50 acting as a stronger overhead barrier. Bias: Bearish below 0.70200
INDICES AND FUTURES Nasdaq 100 futures (NQ) are trading higher at 30863.75, approaching the session high of 30868.75 and close to its 60-day and 52-week swing high of 31094.75. The index is well above all its key moving averages (MA20, MA50, MA200), all of which are sloping upwards, confirming a strong bullish trend. Momentum remains strong, with the next target being a breakout above the 31094.75 resistance. Bias: Bullish above 30679.00
S&P 500 futures (ES) are showing modest gains at 7772.00, staying within a narrow session range. Price is comfortably above its MA20 (7692.20) and MA50 (7660.02), indicating sustained upward momentum. The 60-day and 52-week swing high of 7848.50 remains the primary resistance target. The 50% Fibonacci retracement from the 60-day swing low (7324.00) to the 60-day swing high (7848.50) is near 7586.25, providing a strong support level. Bias: Bullish above 7748.50
Dow futures (YM) are marginally higher at 51759.00, trading near the session high of 51775.00. The index is below its MA20 (52481.40) and MA50 (52917.28), but above its MA200 (50348.18), indicating a short-term bearish bias within a longer-term bullish trend. Immediate resistance is at the previous close of 51717.00, with support at the session low of 51610.00. A break below the 60-day swing low of 51209.00 would be a significant bearish development. Bias: Neutral-to-bearish below 52481.40
DAX is experiencing weakness, down 0.57% at 25266.53, trading below its previous close of 25410.63. The index is firmly below its MA20 (25761.43) and MA50 (25785.80), suggesting a downtrend. Support is found near the MA200 at 24794.74 and the 60-day swing low of 24651.34. The session high of 25424.21 acts as immediate resistance. Bias: Bearish below 25424.21
FTSE 100 is trading lower at 10679.99, below its previous close and below its MA20 (10745.51) and MA50 (10761.65). The index is still above its MA200 (10423.29), suggesting a potential consolidation or pullback within a broader uptrend. Immediate support is at the session low of 10666.91, with resistance at the previous close of 10705.30. A break below the MA200 could signal deeper corrections. Bias: Neutral-to-bearish below 10745.51
COMMODITIES Spot gold (XAU/USD) is up modestly at 4306.80, bouncing off the session low of 4290.30. Gold is trading below all its key moving averages (MA20, MA50, MA200), indicating a persistent bearish trend. The 60-day swing low of 3963.00 remains a key support target if current levels fail. ATR14 at 91.56 suggests high volatility, with resistance at the previous close of 4298.00 and the session high of 4331.00. Bias: Bearish below 4331.00
Spot silver (XAG/USD) is gaining 1.07% at 64.135, outperforming gold, but remains below its MA20 (65.272) and MA200 (72.656). However, it is trading above its MA50 (63.628), suggesting potential for short-term positive momentum. The 60-day swing low of 55.015 provides strong support, with the 60-day swing high of 71.160 acting as resistance. Bias: Neutral-to-bullish above 63.628
Copper is showing strength, up 0.68% at 6.76400, approaching the 60-day and 52-week swing high of 6.83000. Price is well above all its key moving averages (MA20, MA50, MA200), all of which are rising, confirming a strong bullish trend. Immediate resistance is at the session high of 6.78000. A breakout above 6.83000 would be a significant bullish signal. Bias: Bullish above 6.73400
WTI crude is down significantly by 2.03% at 92.690, breaching its previous close of 94.610. Price has fallen below its MA20 (95.323), but remains above its MA50 (88.047) and MA200 (81.547). The session low of 92.410 is immediate support. Further downside could target the 50-day MA. ATR14 at 4.863 indicates high volatility. Bias: Neutral-to-bearish below 95.323
Brent crude is also experiencing a notable decline, down 1.28% at 105.240. Price is trading below its previous close and has fallen below its MA20 (100.835) but remains significantly above its MA50 (93.774) and MA200 (86.698). The session low of 104.910 is key support, with the 60-day swing high of 110.190 representing strong resistance. Bias: Neutral-to-bearish below 100.835
Natural gas is marginally lower at 3.28900, trading within a tight range. Price is above all its key moving averages (MA20, MA50, MA200), suggesting a bullish trend, despite the minor overnight dip. The 60-day swing high of 3.35500 is within reach and represents the next resistance target. Immediate support is at the session low of 3.24800. Bias: Bullish above 3.24800
RATES US 10-year Treasury yield is up 0.94% at 5.16200, approaching its 60-day and 52-week swing high of 5.18100. The yield is well above all its key moving averages (MA20, MA50, MA200), which are all rising, indicating strong bullish momentum. A breakout above 5.18100 would signal further increases. The previous close of 5.11400 serves as immediate support. Bias: Bullish above 5.11400
CRYPTO Total crypto market cap is $1691.28bn. Bitcoin (BTC/USDT) is marginally higher at 84187.00, trading within its 24-hour range of 82941.00-84845.00. Current price sits above its previous close of 83967.38, indicating slight positive momentum. With no MA or momentum data, immediate support is at the 24-hour low of 82941.00, and resistance at the 24-hour high of 84845.00. Bias: Neutral-to-bullish above 82941.00
Ethereum (ETH/USDT) is slightly lower at 2679.74, trading near its previous close of 2682.61. The 24-hour range of 2634.74-2700.84 defines immediate support and resistance. Lack of MA data limits deeper technical analysis, but current price action suggests consolidation. Bias: Neutral below 2700.84
Solana (SOL/USDT) shows positive momentum, up 1.36% at 116.43, approaching the upper end of its 24-hour range of 112.72-118.36. Price is trading above its previous close of 114.86, suggesting short-term strength. Immediate resistance is at the 24-hour high of 118.36. Bias: Bullish above 112.
Equities, particularly NQ and ES, are showing bullish momentum, maintaining above key MAs, suggesting a continuation of the uptrend. Conversely, FX majors like EUR/USD and GBP/USD are bearish, aligning with DXY's slightly weaker but overall firm posture, while commodities are mixed with WTI and Brent down, but copper and natural gas firm. The US 10-year yield is pressing higher, nearing multi-year highs, which could introduce cross-asset volatility.