
Technical Analysis as markets look towards NFP tomorrow: EUR/USD, Gold, Nasdaq, Oil & Bitcoin Levels — 1 October 2026
Global markets are quite low volume with not a massive amount off direction right now awaiting the next high impact news catalyst, NFP non farm payrolls US labor market data and if it gives signals as to the next inflation data print .
FOREX
US Dollar Index (DXY) The Dollar Index trades firmly higher at 101.840, up 0.38 percent on the session and pressing against the fresh 52-week and 60-day high of 101.996. Price action displays a pristine bullish market structure, holding comfortably above its upward-sloping 20-day moving average of 100.204, 50-day moving average of 99.986, and 200-day moving average of 99.254. The index has established an intraday low at 101.459, matching the prior session close of 101.450 before grinding higher into the European cross-asset open. A daily close above the 102.000 psychological barrier activates the 127.2 percent Fibonacci extension projection at 102.875, measured off the 60-day range of 98.560 to 101.996. Immediate support aligns at 101.450, followed by the daily pivot zone near 101.000 and the 14-day ATR buffer at 101.382. Momentum oscillators remain firmly embedded in bullish territory with expanding daily trading bands confirming upside trend continuation. Bias: Bullish above 101.450.
EUR/USD EUR/USD trades heavily at 1.12930, down 0.42 percent intraday and pressing directly into its 52-week low at 1.12700. The pair exhibits a persistent bearish market structure characterized by consecutive lower highs and lower lows below its downward-sloping 20-day moving average of 1.14950 and 50-day moving average of 1.15320. Daily momentum continues to track in oversold territory as the session range of 1.12700 to 1.13400 fails to generate sustained buying interest above the prior close of 1.13408. Primary resistance sits at the 20-day moving average of 1.14950, which coincides with the 50 percent retracement of the 60-day decline from 1.17123 to 1.12701. A confirmed break below the 1.12700 support floor opens the path toward psychological round-number support at 1.12000 and the 127.2 percent Fibonacci extension at 1.11500. Corrective bounces remain capped by the 14-day ATR span of 0.00450 near the 1.13380 to 1.13400 prior resistance block. Bias: Bearish below 1.13400.
GBP/USD Cable remains subdued at 1.32210, sliding 0.09 percent as bearish trend continuation dominates price action near the lower boundary of its 60-day range. The pair trades well below its descending 20-day moving average of 1.33970, 50-day moving average of 1.34580, and 200-day moving average of 1.34480, reflecting an entrenched intermediate downtrend. Intraday price action has carved out a session range between 1.31950 and 1.32730, hovering just above the 60-day cycle low of 1.31945. Overhead resistance is anchored at the previous session close of 1.32328, followed by the 38.2 percent Fibonacci retracement of the 1.36750 to 1.31945 leg located at 1.33781. A sustained breach below 1.31945 exposes the multi-month baseline and 52-week trough at 1.30120. Volatility remains contained within a 0.00590 ATR14 band, with moving average convergence divergence indicators showing negative distribution. Bias: Bearish below 1.32730.
USD/JPY USD/JPY advances 0.41 percent to 158.053, rebounding strongly from its session low of 157.303 and extending above its 20-day moving average of 156.085. Spot is testing heavy overhead congestion defined by the flat 50-day moving average of 158.285 and the 200-day moving average of 158.481, which mark the primary pivot zone for intermediate direction. The session high of 158.454 directly tests this long-term moving average cluster, where a breakout would target the 60-day swing peak at 163.979. Intraday pullbacks find support at the prior close of 157.404, followed by the 14-day ATR baseline near 156.955. Momentum indicators show stochastic oscillators rotating upward out of neutral territory with MACD histograms printing positive divergence. Failure to clear the 158.481 hurdle would keep the pair locked inside its broader 152.897 to 163.979 trading range. Bias: Bullish above 157.300.
AUD/USD The Australian Dollar is trading sharply lower at 0.69480, falling 0.59 percent after failing to defend the psychological 0.70000 threshold. Price action trades below its 20-day moving average of 0.71100, 50-day moving average of 0.70930, and 200-day moving average of 0.70280, confirming a breakdown in trend structure. The session range has been compressed between 0.69340 and 0.69570, slipping beneath the prior close of 0.69890 and threatening the 60-day swing low of 0.69137. Key overhead resistance is now located at the 200-day moving average of 0.70280, followed by the 50 percent retracement of the 0.69137 to 0.72390 swing at 0.70764. A clean break below 0.69137 brings the 52-week low of 0.64220 into longer-term focus, with initial Fibonacci extension targets landing at 0.68350. ATR14 sits at 0.00350, signaling steady trend liquidation with no immediate candlestick reversal signatures evident. Bias: Bearish below 0.69890.
INDICES AND FUTURES
Nasdaq 100 (NQ) Nasdaq 100 futures trade higher by 0.46 percent at 30840.00, continuing an aggressive secular advance within touching distance of fresh contract highs. The contract printed a session peak and new 52-week high of 31151.50 before consolidating above the session low of 30684.50 and prior close of 30698.75. Trend alignment is decisively bullish across all timeframes, positioned well above the rising 20-day moving average of 29984.16, 50-day moving average of 29529.78, and 200-day moving average of 27573.38. Technical pullbacks are supported by the 23.6 percent Fibonacci retracement of the 27201.50 to 31151.50 swing at 30221.30, followed by the 20-day moving average. Daily ATR stands at 462.27 points, reflecting robust expansionary volatility that favors buying shallow dips into VWAP. A sustained push through 31151.50 activates the 127.2 percent Fibonacci projection at 32155.42. Bias: Bullish above 30684.50.
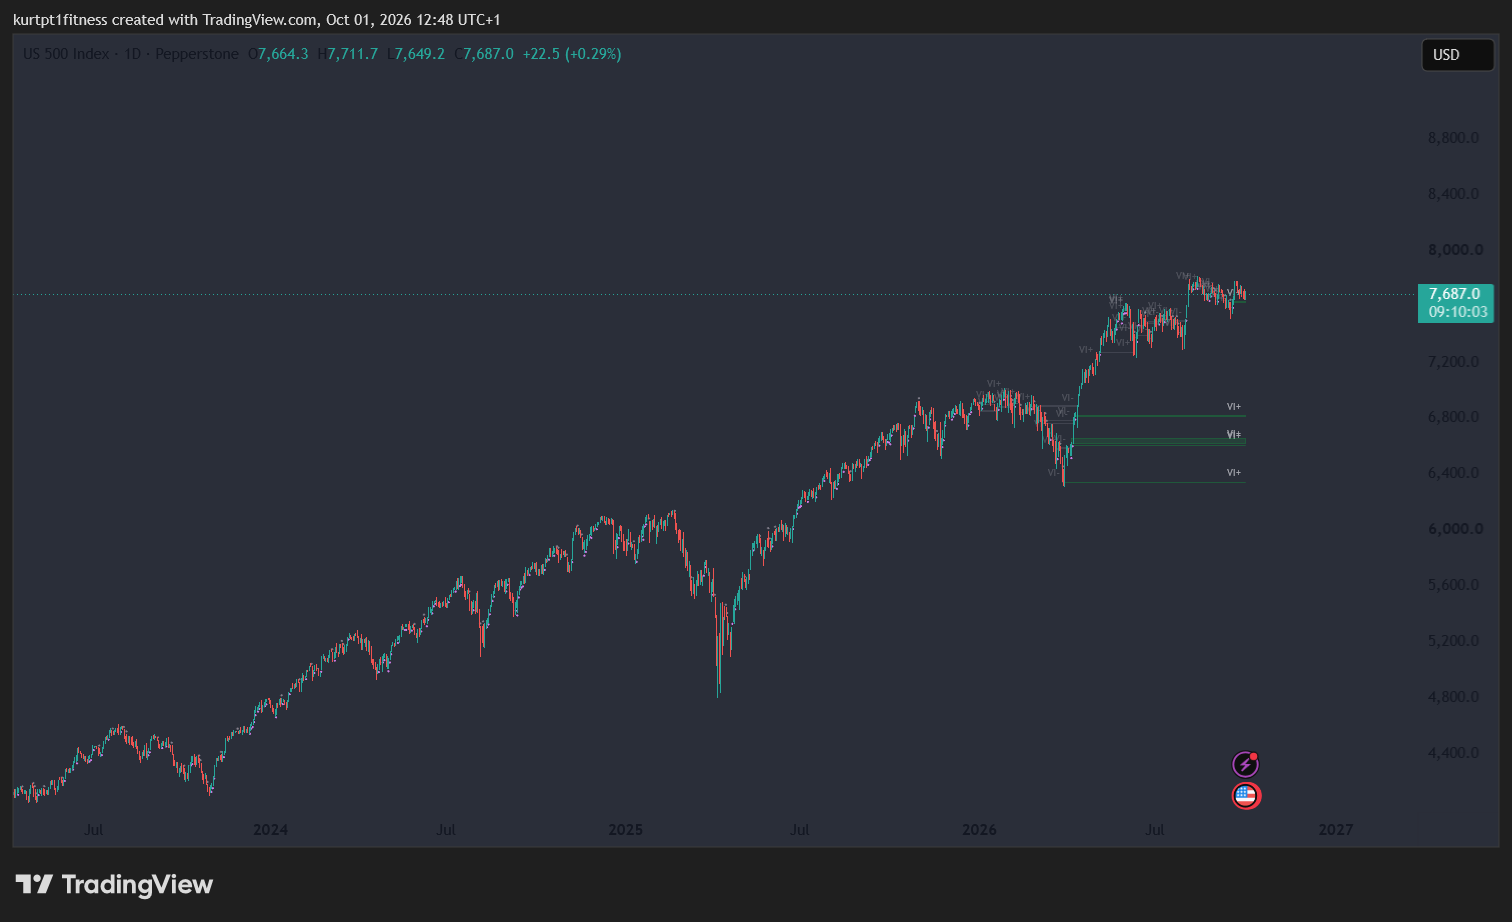
S&P 500 (ES) S&P 500 futures trade up 0.18 percent at 7729.25, demonstrating constructive consolidation above the prior session close of 7715.50. Price action holds above its key moving averages, with the 20-day moving average at 7702.95, 50-day moving average at 7677.76, and 200-day moving average at 7249.49 establishing a layered support structure. The session range has spanned from 7705.00 to 7767.75, keeping the market within striking distance of the 60-day and 52-week record peak at 7848.50. Fibonacci analysis of the 7324.00 to 7848.50 leg places the 38.2 percent retracement at 7648.13, offering solid structural support should deeper profit-taking unfold. Momentum remains positive with the index maintaining higher daily swing lows and absorbing macro yield headwinds. A break above 7767.75 clears the path for a retest of 7848.50, while ATR14 volatility measures 75.63 points. Bias: Bullish above 7702.95.
Dow (YM) Dow futures are virtually unchanged at 51269.00, down 0.02 percent as industrial components lag broader technology performance. The contract remains locked below its declining 20-day moving average of 52167.25 and 50-day moving average of 52860.28, although it maintains an elevated posture above the long-term 200-day moving average of 50415.93. The session range of 50936.00 to 51493.00 directly tested the 60-day swing low of 50936.00 before staging a modest intraday recovery toward the prior close of 51278.00. Overhead resistance sits at the 38.2 percent Fibonacci retracement of the 54884.00 to 50936.00 decline at 52444.15, followed by the 50-day moving average. A daily settlement below 50936.00 would confirm a bearish head-and-shoulders breakdown, exposing the 200-day average at 50415.93 and the 50000.00 psychological round number. The daily ATR of 590.79 points indicates elevated range potential during the transatlantic crossover. Bias: Bearish below 51493.00.
DAX The German DAX trades lower at 25138.15, down 0.24 percent on the session as European equities absorb tightening financial conditions. The index trades beneath its 20-day moving average of 25515.95 and 50-day moving average of 25837.31, while holding just above its critical 200-day moving average support at 24829.98. Today's intraday range spans from 24831.60 to 25181.46, with the session low precisely tagging the 200-day moving average before dip-buyers emerged ahead of the 25199.19 previous close. The 60-day swing structure between 24651.34 and 26618.74 defines immediate support at the 24651.34 trough and resistance at the 38.2 percent Fibonacci retracement of 25402.66. A sustained drop below 24829.98 would signal a major structural breakdown toward the 52-week base at 21863.81. ATR14 volatility reads 280.72 points, keeping short-term price action highly sensitive to rate moves. Bias: Bearish below 25515.95.
FTSE 100 The FTSE 100 exhibits pronounced relative weakness, dropping 1.25 percent to trade at 10472.92. The index has breached its 20-day moving average of 10692.11 and 50-day moving average of 10767.41, hovering right on top of its 200-day moving average of 10452.08. Today's session range of 10390.73 to 10606.39 marked a new 60-day low at 10390.73, fully erasing recent gains from the prior close of 10606.00. Immediate resistance is found at the previous close of 10606.00, with major secondary supply anchored at the 20-day moving average of 10692.11. Fibonacci analysis of the move from the 10390.73 low to the 10989.50 record high indicates that failing to reclaim 10619.66 leaves the index vulnerable to extended losses toward 10000.00 and the 52-week low of 9276.90. Daily ATR stands at 110.44 points with momentum oscillators deeply oversold. Bias: Bearish below 10606.00.
COMMODITIES
Spot Gold (XAU/USD) Spot gold trades at 4201.80, up 0.36 percent as it stabilizes after a multi-week correction from its 52-week peak of 5586.20. The precious metal trades below its downward-sloping 20-day moving average of 4353.19, 50-day moving average of 4364.02, and 200-day moving average of 4554.23. The session range has spanned from 4169.40 to 4222.80, holding above the prior close of 4186.70 and defending the lower half of the 60-day swing between 3963.00 and 4755.00. Key overhead resistance aligns at the 50 percent retracement of that 60-day decline at 4359.00, which converges directly with the 20-day and 50-day moving average cluster. Primary downside support lies at the 60-day cycle low of 3963.00, followed by the 52-week support base at 3842.80. ATR14 sits at 88.25 dollars, indicating that daily volatility remains wide as gold balances yield pressure against safe-haven flows. Bias: Neutral-bearish below 4353.19.
Spot Silver (XAG/USD) Spot silver advances 1.76 percent to trade at 61.155, outperforming gold following an intraday rebound from 60.260 to 61.750. Price action remains below the 20-day moving average of 64.307, 50-day moving average of 63.859, and 200-day moving average of 72.643, keeping the broader technical bias cautious. The metal is attempting to build a base above the prior close of 60.098, with the 60-day swing range of 55.015 to 71.160 framing near-term boundaries. Resistance is located at the 38.2 percent Fibonacci retracement of that decline at 61.185, followed by the 50-day moving average at 63.859 and the 50 percent level at 63.088. A failure to sustain gains above 60.000 risks a retest of the 55.015 cycle low and the 52-week baseline at 45.385. The 14-day ATR of 0.726 points to expanding daily swings within this basing pattern. Bias: Neutral-bullish above 60.260.
Copper Copper futures trade flat with a slight positive tilt at 6.56400, up 0.08 percent on the day. The metal is wedged between its 20-day moving average of 6.58780 and its 50-day moving average of 6.55100, while preserving an underlying bullish posture above the 200-day moving average of 6.11200. Session price action has moved between 6.50900 and 6.64600, holding just above the prior close of 6.55900. Overhead resistance stands at the session high of 6.64600, with major supply defined by the 60-day and 52-week peak at 6.83000. Downside support rests at the 50-day moving average of 6.55100, followed by the 61.8 percent Fibonacci retracement of the 6.06950 to 6.83000 rally at 6.36001. With ATR14 measured at 0.06680, copper continues to exhibit tight consolidation near the upper quadrant of its annual range. Bias: Bullish above 6.55100.
WTI Crude WTI crude oil trades higher by 2.00 percent at 92.230, rebounding strongly from an intraday low of 88.790 to a session peak of 92.900. The recovery pushes spot above its 50-day moving average of 88.585 and well clear of the 200-day moving average of 82.210, though it remains below the 20-day moving average of 96.022. Price action has reclaimed the prior close of 90.420 and is pressing toward the 61.8 percent Fibonacci retracement of the 70.770 to 106.750 advance located at 93.000. A daily close above 93.000 opens the door for a retest of the 20-day moving average at 96.022 and psychological resistance at 100.000. Key intraday support is established at 88.790, followed by the 50-day moving average. Daily ATR stands at 4.717 dollars, highlighting elevated energy market volatility driven by supply dynamics. Bias: Bullish above 88.790.
Brent Crude Brent crude trades at 100.630, declining 2.80 percent on the session despite holding above the key psychological 100.000 benchmark. The contract has printed a wide session range of 96.560 to 100.830, trading beneath its prior close of 103.530 and its 20-day moving average of 102.887. The longer-term trend remains positive with price action situated above the rising 50-day moving average of 94.748 and 200-day moving average of 87.521. Fibonacci analysis of the 60-day swing from 75.310 to 110.190 places the 38.2 percent retracement support at 96.864, which was rigorously defended during today's test of 96.560. Resistance is now established at the 20-day moving average of 102.887 and the prior close of 103.530. With a 14-day ATR of 4.618 dollars, Brent is undergoing a sharp technical reset within an otherwise constructive medium-term channel. Bias: Bearish below 102.887.
Natural Gas Natural gas slides 2.25 percent to 2.95800, giving up ground after testing an intraday high of 3.01600. The contract is currently oscillating around its 20-day moving average of 2.95610 and remains above the 50-day moving average of 2.85230, though it trades well below the 200-day moving average of 3.15450. Today's trading range of 2.94800 to 3.01600 reflects rejection from the 3.00000 round number and previous close of 3.02600. Key support aligns at the 50-day moving average of 2.85230, followed by the 60-day swing low of 2.61600. Reclaiming 3.02600 is necessary to re-engage the 60-day high of 3.31700 and the 200-day moving average. Volatility remains active with ATR14 at 0.12690, pointing to continued range-bound digestion. Bias: Neutral-bearish below 3.02600.
RATES
US 10-Year Treasury Yield The US 10-year Treasury yield is pushing higher to trade at 5.29300 percent, gaining 0.72 percent and hovering directly near its 52-week peak of 5.29300 and 60-day swing high of 5.30600. The benchmark yield exhibits an exceptionally strong bullish trend across all horizons, trading well above its upward-sloping 20-day moving average of 4.99950, 50-day moving average of 4.80870, and 200-day moving average of 4.43970. The prior session close of 5.25500 now acts as immediate structural support, followed by the 5.00000 psychological handle and 20-day moving average. A decisive breakout above 5.30600 would extend the macro rate expansion toward the 127.2 percent Fibonacci projection at 5.52200, calculated off the 60-day range of 4.51100 to 5.30600. Momentum oscillators show ADX trend strength elevated above 35, confirming powerful directional conviction. Yield pullbacks are expected to find aggressive bidding at the 14-day ATR buffer of 5.22460. Bias: Bullish above 5.25500.
CRYPTO
Crypto Market Overview Total crypto market capitalization stands at 2.85 trillion dollars with Bitcoin dominance recorded at 58.85 percent. The digital asset complex is exhibiting tight consolidation near multi-month highs, with Bitcoin maintaining market leadership while select large-cap alternative tokens undergo mild mean reversion.
Bitcoin (BTC/USDT) Consensus pricing across CoinGecko and Binance klines places Bitcoin at 83862.00, up 0.08 percent on the day with 24-hour volume reaching 37.23 billion dollars and market capitalization standing at 1684.59 billion dollars. BTC/USDT trades within an intact multi-month bullish channel, positioned well above its rising 20-day moving average of 81661.64, 50-day moving average of 77704.29, and 200-day moving average of 71355.19. The 24-hour trading range spans from 83182.00 to 85518.00, consolidating just below the 60-day swing high of 87395.67. Momentum remains overbought with RSI14 printing at 75.4, suggesting brief sideways consolidation or flag formation before the next breakout attempt. Support is anchored at the previous close of 83790.95 and the 20-day moving average of 81661.64, which coincides with the 23.6 percent Fibonacci retracement of the 62300.00 to 87395.67 swing. A decisive breakout through 87395.67 opens the pathway toward the 52-week peak of 126199.63. ATR14 volatility measures 2393.07 dollars. Bias: Bullish above 81661.64.
Ethereum (ETH/USDT) Ethereum trades at 2697.60, gaining 0.08 percent across CoinGecko and Binance klines with a 24-hour volume of 15.31 billion dollars and a market capitalization of 329.29 billion dollars. Ether maintains a strong bullish trend alignment, holding above its 20-day moving average of 2620.24, 50-day moving average of 2452.79, and 200-day moving average of 2113.42. The 24-hour range of 2667.89 to 2736.98 keeps price action tightly coiled below the 60-day swing peak of 2807.34. The 14-day RSI reads 76.8, signaling extended momentum that is currently consolidating via an intraday bull pennant. Immediate support is established at the prior close of 2695.41, followed by the 20-day moving average at 2620.24 and the 38.2 percent Fibonacci retracement of the 1828.62 to 2807.34 run at 2433.51. Reclaiming and clearing 2807.34 exposes the 3000.00 psychological level and the 52-week high zone of 4755.00. The 14-day ATR stands at 94.29 dollars. Bias: Bullish above 2620.24.
Solana (SOL/USDT) Solana trades at 117.67, retreating 1.53 percent over the past 24 hours based on CoinGecko and Binance klines feeds, with 24-hour volume at 4.23 billion dollars and market capitalization at 69.18 billion dollars. Despite the short-term pullback, SOL/USDT preserves a bullish medium-term structure above its ascending 20-day moving average of 112.24, 50-day moving average of 102.06, and 200-day moving average of 85.60. The 24-hour range of 117.08 to 122.60 reflects profit-taking beneath the 60-day peak of 124.95, following an extended rally off the 71.98 cycle low. RSI14 moderates to 71.5, cooling from extreme overbought levels while remaining in a bullish regime. Dynamic support rests at the 20-day moving average of 112.24, which aligns with the 23.6 percent Fibonacci retracement at 112.45. A breakout above 124.95 clears the path toward the 127.2 percent Fibonacci extension at 139.11 and the 52-week high of 237.79. ATR14 is registered at 5.77 dollars. Bias: Bullish above 112.24
Watch the interaction between the US 10-year yield near 5.300 percent and the DXY at 101.996 as London traders step in, where further rate upside will keep European bourses and commodity FX pinned near multi-month lows. In contrast, NQ futures holding 30684.50 and Bitcoin defending 83182.00 will dictate whether growth assets can sustain their decoupling from sovereign bond weakness.
another story circulating is president trump says he does not blame kevin warsh for higher interest rates implying there are other entities within the federal reserve responsible for bias on higher borrowing costs on the dollar .