
FOREX
EUR/USD EUR/USD is trading at 1.14890, marginally up in the Asian session but below its previous close of 1.14760, suggesting immediate upward momentum is weak. The pair remains firmly below its 20, 50, and 200-day moving averages at 1.15950, 1.15390, and 1.16290 respectively, indicating a bearish trend on multiple timeframes. Current price is near the session high of 1.14960, with the 60-day swing low at 1.13545 providing significant support below. A break below 1.14590 (session low) could target the 1.14200 level. Resistance looms at the 1.15000 psychological level and the 50% retracement of the 60-day swing at 1.15334. Bias: Bearish below 1.15334.
GBP/USD GBP/USD currently stands at 1.33940, posting a notable gain in the session, moving towards the session high of 1.33990. However, the pair is trading well below its 20-day MA at 1.35200 and 50-day MA at 1.34840, confirming a prevailing downtrend. The 60-day swing low at 1.32148 offers robust support, while the 50% retracement of the 60-day swing at 1.34449 serves as immediate resistance. A sustained break above the 1.34000 psychological level could test the 1.34449 resistance, while failure to hold above 1.33370 (session low) may invite further selling towards 1.33000. Bias: Bearish below 1.34449.
USD/JPY USD/JPY is at 156.855, significantly up from its previous close, indicating strong bullish pressure. The pair's current level is above its 20-day MA of 156.762, suggesting a shift towards short-term bullish momentum, but remains below the 50-day MA at 159.044. With a tight session range implying limited immediate counter-move, the 60-day swing high at 163.979 remains the ultimate upside target, while the 60-day swing low at 152.897 provides long-term support. Immediate resistance is found at 157.000, with support at 156.500. A break below 156.129 (prev close) would invalidate the current bullish outlook. Bias: Bullish above 156.129.
AUD/USD AUD/USD is trading at 0.71210, marginally higher but within a tight session range, reflecting consolidation. The pair is below its 20-day MA of 0.71650 but above its 50-day MA of 0.70850, indicating mixed short-term sentiment within a broader uptrend. The 60-day swing high at 0.72390 and 60-day swing low at 0.68657 define the current trading band. Immediate resistance is at 0.71500, with strong support at 0.71000 and the 50-day MA at 0.70850. Failure to hold the 0.71000 level could open a path to the 0.70500 region. Bias: Neutral; bullish above 0.70850, bearish below 0.71650.
US Dollar Index (DXY) DXY currently trades at 100.215, flat after the previous close, yet it holds above its 20-day MA (99.362) and 50-day MA (99.951), indicating a short-to-medium term bullish bias. The index is trading below its session high of 100.564, suggesting some resistance. The 60-day swing high of 101.750 remains a key target, with the 50% retracement of the 60-day swing at 100.155 providing immediate support. A break below 100.155 could see a retest of the 99.951 level (50-day MA), while a push above 100.564 could target 100.800. Bias: Bullish above 99.951.
INDICES AND FUTURES
Nasdaq 100 futures (NQ) NQ futures are trading strongly at 29917.25, up 1.60%, having broken above the previous close of 29446.75 and currently near the session high of 29993.25. The contract is well above its 20, 50, and 200-day moving averages (29340.15, 29276.07, 27342.16), confirming a robust uptrend. Immediate resistance is the psychological 30000 level and the 60-day swing high of 30599.75. Support is found at the session low 29648.00 and the 20-day MA at 29340.15. The 61.8% Fibonacci extension from the 60-day swing high could target 30605. Bias: Bullish above 29648.00.
S&P 500 futures (ES) ES futures are at 7712.50, up 0.95%, maintaining positive momentum from the previous close. The contract is above its 20-day MA (7667.64) and 50-day MA (7639.82), indicating continued bullish sentiment. Current price is within reach of the 60-day swing high of 7838.50. Immediate resistance is at the session high 7739.25, followed by the 7800.00 psychological level. Support is at the 20-day MA of 7667.64 and the session low of 7675.00. A break below 7639.82 (50-day MA) would be a bearish signal. Bias: Bullish above 7667.64.
Dow futures (YM) YM futures are trading at 52079.00, up 0.53%, showing modest gains. However, the contract remains below its 20-day MA (52857.72) and 50-day MA (52998.17), which suggests a short-term bearish tilt despite today's uptick. Immediate resistance is at the session high of 52380.00 and the 50% retracement of the 60-day swing at 53046.50. Support is firm at the session low of 51888.00 and the 60-day swing low of 51209.00. A move above 52380.00 is required to challenge the MAs. Bias: Bearish below 52857.72.
DAX DAX is trading lower at 25304.06, down 1.60% and below its previous close, indicating strong selling pressure. The index is below its 20, 50, and 200-day moving averages (25881.76, 25765.97, 24771.50), confirming a bearish trend. The current price is near the session low of 25285.90, with strong support at the 60-day swing low of 24556.78. Immediate resistance is at the previous close of 25716.71 and the 20-day MA at 25881.76. Further downside targets the 25000 psychological level. Bias: Bearish below 25716.71.
FTSE 100 FTSE 100 is at 10659.13, down 1.45%, showing significant weakness and trading below its previous close. The index is below its 20-day MA (10767.15) and 50-day MA (10749.66), signaling a short-term downtrend. Current price is near the session low of 10650.16. Resistance is found at the previous close of 10816.10 and the 20-day MA. Support is strong at the 60-day swing low of 10397.50. A retest of 10600 is possible if selling pressure persists. Bias: Bearish below 10749.66.
COMMODITIES
Spot gold (XAU/USD) Spot gold is trading at 4424.90, up 0.57%, recovering some of the previous session's losses. It is above its 50-day MA (4325.25) but below its 20-day MA (4492.09) and 200-day MA (4553.35), suggesting a mixed to slightly bearish bias overall. Immediate resistance is at the session high of 4439.80, followed by the 20-day MA. Support is strong at the 4400.00 psychological level and the previous close of 4399.70. A break above 4439.80 could target 4450.00. Bias: Neutral; bullish above 4400.00, bearish below 4492.09.
Spot silver (XAG/USD) Spot silver is making a strong move, up 2.56% to 67.149, trading above its 20-day MA (66.289) and 50-day MA (62.938), indicating renewed bullish momentum. However, it remains significantly below its 200-day MA (72.482). Immediate resistance is at the session high of 67.895, followed by the 68.000 psychological level. Support is firm at the 20-day MA of 66.289 and the previous close of 65.470. A sustained move above 67.895 could target 69.000. Bias: Bullish above 66.289.
Copper Copper is trading at 6.69150, up 1.59%, showing strong bullish sentiment. It is above its 20, 50, and 200-day moving averages (6.56090, 6.49290, 6.05180), confirming a clear uptrend. The current price is near the session high of 6.72500 and approaching the 60-day swing high of 6.80550. Immediate support is at the previous close of 6.58650 and the 20-day MA. A push above 6.72500 targets 6.75000 and then the 60-day swing high. Bias: Bullish above 6.58650.
WTI crude WTI crude is at 96.080, down 5.72%, experiencing a sharp decline and trading well below its previous close. Despite the drop, the current price remains above its 20, 50, and 200-day moving averages (92.841, 86.399, 80.679), suggesting the broader uptrend may still be intact but under significant pressure. Immediate support is at the session low of 94.830 and the 20-day MA. Resistance is at the previous close of 101.910. A sustained break below the 20-day MA could signal a deeper correction. Bias: Bullish above 94.830; caution on severe downside momentum.
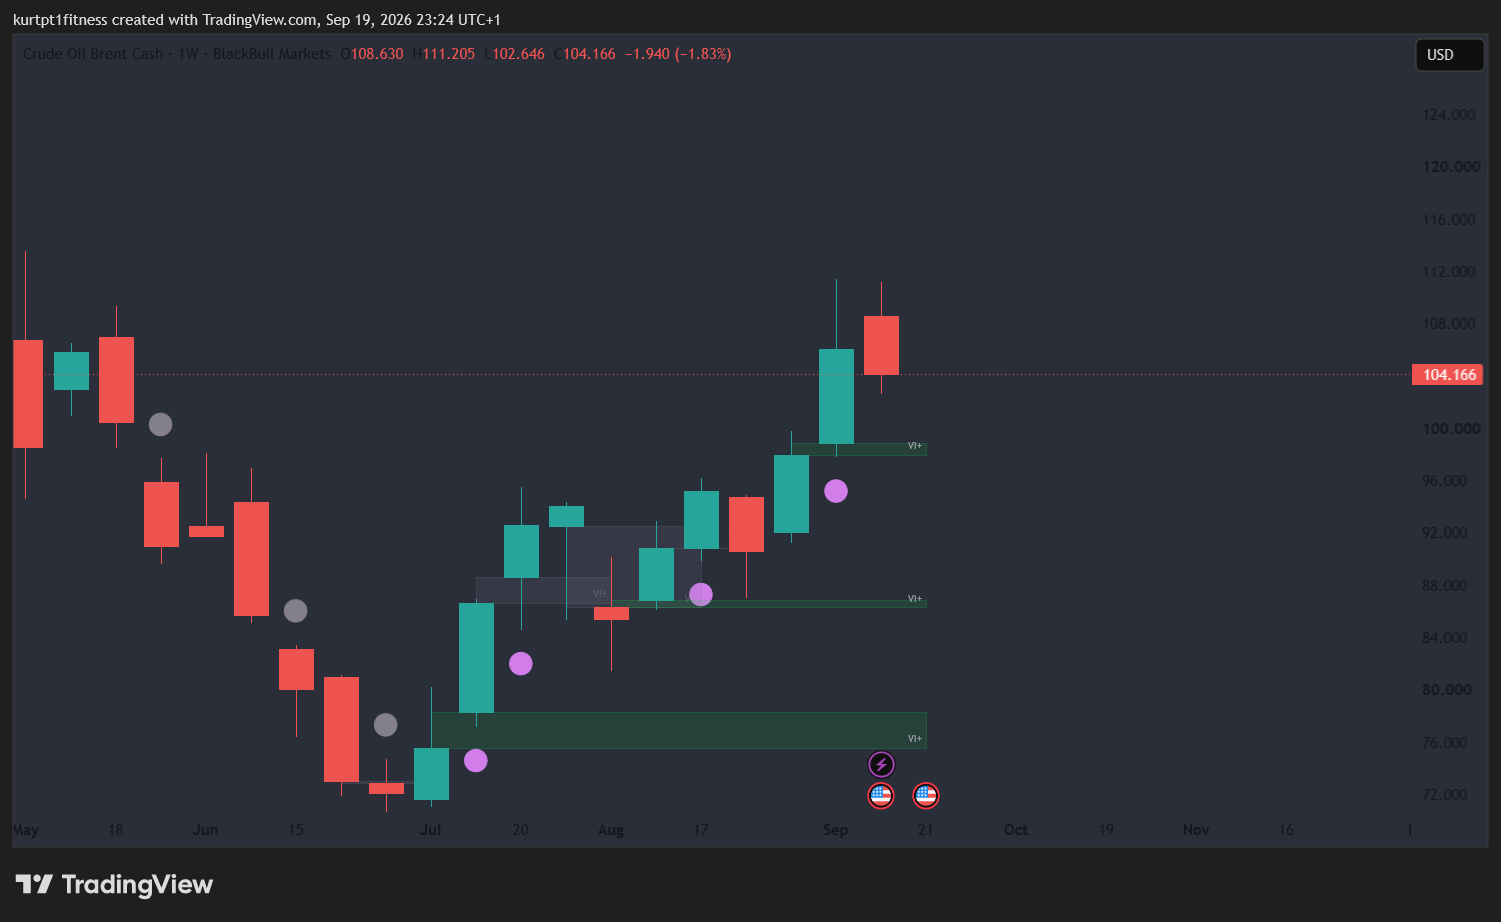
Brent crude Brent crude is at 99.290, down 5.28%, mirroring WTI's steep decline. Like WTI, Brent is still trading above its 20, 50, and 200-day moving averages (97.744, 91.748, 85.699), implying the overall uptrend is stressed but not yet broken. Current price is near the session low of 97.810, which acts as immediate support, along with the 20-day MA. Resistance is at the previous close of 104.820. A failure to hold 97.744 could see a test of 95.000. Bias: Bullish above 97.744; caution on severe downside momentum.
Natural gas Natural gas is at 2.91200, up 0.38%, showing marginal gains and consolidating above its previous close. The commodity is trading above its 20-day MA (2.87840) and 50-day MA (2.82780) but below its 200-day MA (3.23100), indicating a short-term bullish bias within a longer-term bearish context. Immediate resistance is at the session high of 2.94300, followed by the 3.00000 psychological level. Support is firm at the 20-day MA of 2.87840 and the session low of 2.84600. Bias: Bullish above 2.87840.
RATES
US 10-year Treasury yield The US 10-year Treasury yield is at 4.99800, up 1.03%, pushing higher towards the 5.000% psychological level. The yield is trading above its 20, 50, and 200-day moving averages (4.82510, 4.71800, 4.39900), indicating a strong and sustained uptrend. The 60-day swing high of 5.01600 is currently in focus as immediate resistance. Support is at the previous close of 4.94700. A break above 5.01600 would signal new highs and could target 5.05000. Bias: Bullish above 4.94700.
Equity indices are diverging, with US futures robustly higher while European indices face pressure. Watch for continued strength in NQ and ES against key MA levels, and further downside for DAX and FTSE below prior close levels, with potential for European markets to follow US lead or lag further on local concerns. FX complex will react to DXY's stability around 100.20 and commodity price action, particularly any sustained break below crude's 20-day MAs.