
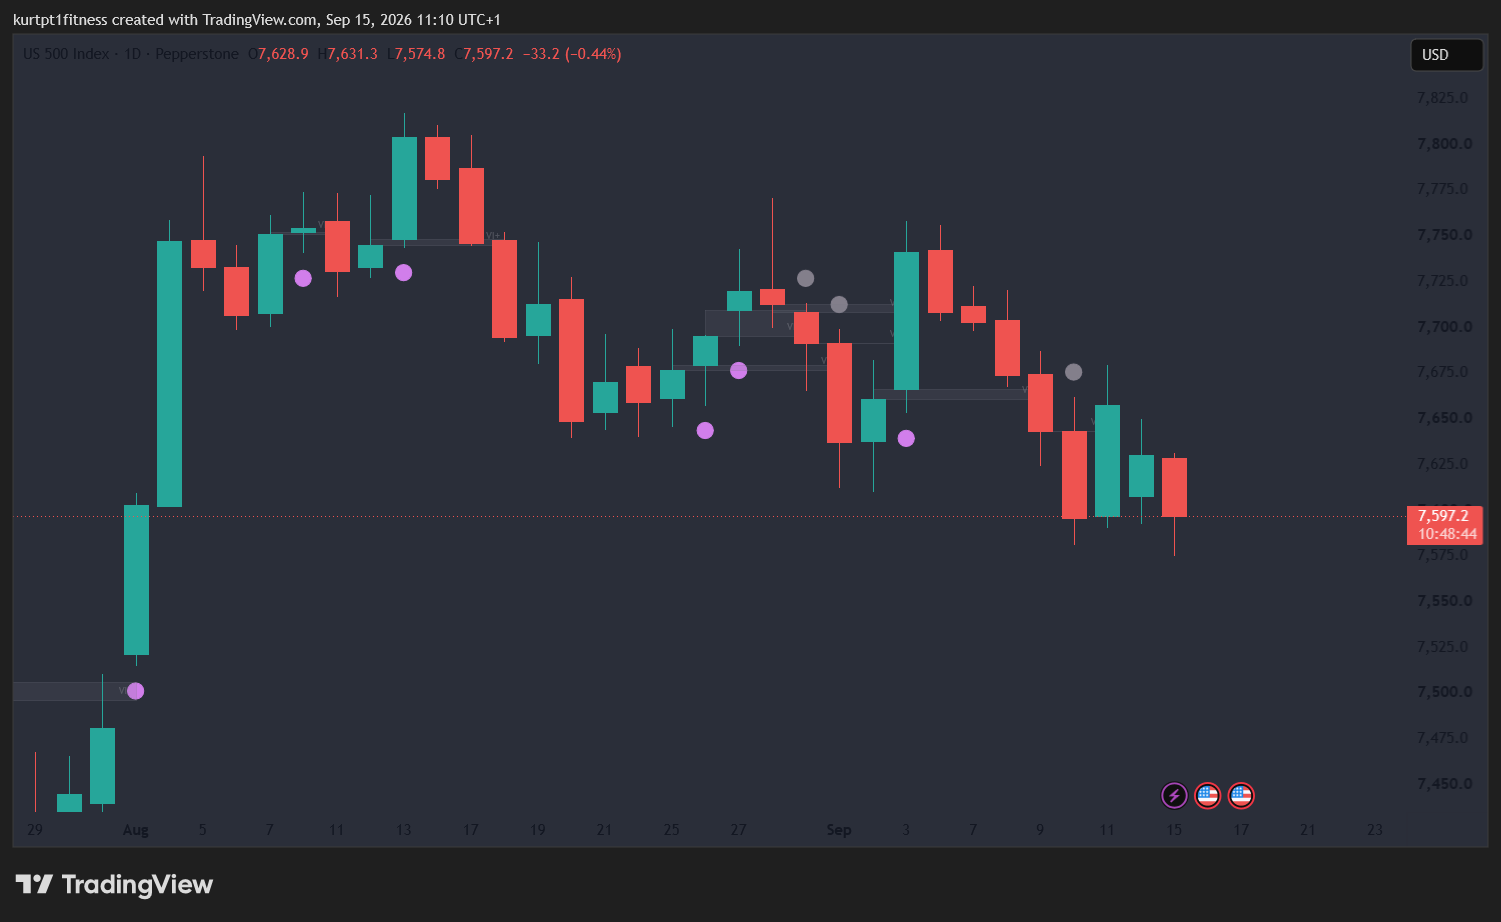
it seems to be a Risk off day with it being the last day off trading before the decision from the federal reserve on borrowing costs on the dollar , with oil prices persisting to be high today making there decision to stay dovish even more difficult .
FOREX EUR/USD: The pair is trading lower, having breached its 50-day MA at 1.15330, now acting as resistance. The current price of 1.15380 sits just above the 50-day MA, indicating a test of this level. It remains below its 20-day MA at 1.16270 and 200-day MA at 1.16330, confirming a bearish short-term structure. The session low of 1.15370 provides immediate support, with the 60-day swing low at 1.13343 as a broader support. The 38.2% Fibonacci retracement of the 60-day swing (1.13343-1.17123) is at 1.15664, which was pierced overnight. Bias: Bearish below 1.15550, invalidated above 1.15550.
GBP/USD: The currency is consolidating below its 20-day MA at 1.35610, currently at 1.34830. It is trading precisely on its 50-day MA at 1.34820, a critical inflection point. The session range 1.34820-1.35050 highlights this tight consolidation around the 50-day MA. The 200-day MA at 1.34520 offers further underlying support, suggesting a cluster of MAs around current prices. The 38.2% Fibonacci retracement of the 60-day swing (1.31532-1.36750) is at 1.34757, providing strong technical confluence with the 50-day MA. Bias: Neutral below 1.35050, invalidated above 1.35050.
USD/JPY: The pair is advancing strongly, up 0.90% and nearing its session high of 154.913. It is trading below its 20-day MA at 157.351, 50-day MA at 159.550, and 200-day MA at 158.404, indicating a larger downtrend despite the intraday strength. The move from the 60-day swing low of 152.897 shows recent buying interest. Immediate resistance is the 155.00 psychological level. The 38.2% Fibonacci retracement of the 60-day swing (152.897-163.979) is at 159.736. Bias: Bullish above 154.202, invalidated below 154.202.
AUD/USD: Currently trading at 0.71240, the pair is down 0.39% and testing the session low of 0.71200. It is positioned below its 20-day MA at 0.71670 but above its 50-day MA at 0.70710 and 200-day MA at 0.70030. This suggests a short-term bearish pressure within a broader neutral to slightly bullish context. The 38.2% Fibonacci retracement of the 60-day swing (0.68657-0.72390) is at 0.70938, which could provide support. Immediate resistance is the previous close at 0.71520. Bias: Bearish below 0.71440, invalidated above 0.71440.
DXY: The Dollar Index is up 0.15% at 99.608, showing strength and holding above its 20-day MA at 99.192 and 200-day MA at 99.141. It is below its 50-day MA at 99.997, which serves as near-term resistance. The session high of 99.643 is being tested, indicating bullish momentum in the early hours. The 38.2% Fibonacci retracement of the 60-day swing (98.560-101.800) is at 100.569, indicating further upside potential if current resistance is overcome. A break above 99.997 would open the path towards 100.00 and 100.569. Bias: Bullish above 99.478, invalidated below 99.478.
INDICES AND FUTURES Nasdaq 100 futures (NQ): NQ is currently at 29372.25, up 0.75%, trading just below its 20-day MA at 29379.78. This MA represents immediate resistance, with a breakout confirming renewed short-term bullishness. The 50-day MA at 29299.88 provides support, indicating a constructive posture above this level. NQ remains well above its 200-day MA at 27285.00, signaling a strong long-term uptrend. The 38.2% Fibonacci retracement of the 60-day swing (27201.50-30968.00) is at 29547.07, aligning closely with the 20-day MA. Bias: Bullish above 29308.50, invalidated below 29308.50.
S&P 500 futures (ES): ES is trading at 7674.25, up 0.65%, positioning it just below its 20-day MA at 7684.48. This MA is a key battleground for intraday direction. Support is provided by the 50-day MA at 7637.82, which it has successfully held above. The 200-day MA at 7197.46 reinforces the long-term bullish trend. The 38.2% Fibonacci retracement of the 60-day swing (7324.00-7838.50) is at 7643.08, a critical support level tested overnight. Bias: Bullish above 7663.00, invalidated below 7663.00.
Dow futures (YM): YM is at 52707.00, up 0.51%, maintaining strength below both its 20-day MA at 53122.65 and 50-day MA at 53080.14. These MAs form a resistance cluster. The 200-day MA at 50184.21 remains far below, affirming a strong long-term uptrend. The 38.2% Fibonacci retracement of the 60-day swing (51630.00-54884.00) is at 53609.52, indicating significant resistance ahead. The session low of 52616.00 provides immediate support. Bias: Neutral below 52906.00, invalidated above 52906.00.
DAX: The DAX is currently at 25440.81, down 0.50%, showing weakness and trading below its 20-day MA at 26000.68 and 50-day MA at 25737.72. The index is holding above its 200-day MA at 24736.22, suggesting the broader uptrend is intact but facing near-term headwinds. The session low of 25325.52 provides immediate support, with the 60-day swing low of 24547.70 as critical long-term support. The 38.2% Fibonacci retracement of the 60-day swing (24547.70-26618.74) is at 25828.60, confirming strong resistance above current levels. Bias: Bearish below 25548.78, invalidated above 25548.78.
FTSE 100: The FTSE 100 is trading at 10697.57, up 0.44%, showing mild recovery but remaining below its 20-day MA at 10773.05 and 50-day MA at 10738.81. These MAs provide immediate resistance. The index is well above its 200-day MA at 10388.00, indicating a long-term bullish trend. The 38.2% Fibonacci retracement of the 60-day swing (10332.40-10989.50) is at 10739.46, coinciding with the 50-day MA and confirming a strong resistance zone. The session high of 10734.85 was rejected. Bias: Neutral below 10734.85, invalidated above 10734.85.
COMMODITIES Spot gold (XAU/USD): Gold is down 0.40% at 4334.40, trading firmly below its 20-day MA at 4464.86 and 200-day MA at 4529.30. It is currently above its 50-day MA at 4275.18, suggesting it is holding a critical support. The session low of 4323.80 was tested, with the 60-day swing low of 3962.50 providing long-term support. The 38.2% Fibonacci retracement of the 60-day swing (3962.50-4670.90) is at 4402.94, representing resistance. Bias: Bearish below 4358.20, invalidated above 4358.20.
Spot silver (XAG/USD): Silver is up 0.34% at 63.730, having found support near the session low of 63.390. It is trading above its 50-day MA at 62.611 but well below its 20-day MA at 66.383 and 200-day MA at 72.342. This indicates a short-term rebound within a broader downtrend. The 38.2% Fibonacci retracement of the 60-day swing (55.015-71.160) is at 65.045, which will be the next key resistance level. Bias: Neutral above 63.390, invalidated below 63.390.
Copper: Copper is showing strength, up 1.16% at 6.40350, nearing its session high of 6.40950. It is trading below its 20-day MA at 6.55250 and 50-day MA at 6.46980, which are acting as overhead resistance. Copper is above its 200-day MA at 6.03140, indicating a long-term bullish trend. The 38.2% Fibonacci retracement of the 60-day swing (5.92850-6.80550) is at 6.47156, aligning with the 50-day MA. Bias: Bullish above 6.36900, invalidated below 6.36900.
WTI crude: WTI is posting strong gains, up 1.69% at 103.100, extending above its 20, 50, and 200-day MAs (90.403, 84.573, 80.025 respectively), which confirm a robust uptrend. It is approaching the 60-day swing high of 104.950, with the 52-week high at 119.480 providing further upside potential. The 38.2% Fibonacci retracement of the 60-day swing (67.040-104.950) is at 90.385, a strong support level well below current prices. Bias: Bullish above 101.830, invalidated below 101.830.
Brent crude: Brent crude is also advancing, up 1.47% at 107.230, trading well above its 20, 50, and 200-day MAs (95.763, 89.997, 85.066 respectively). This confirms a strong bullish momentum and a sustained uptrend. It is approaching the 60-day swing high of 110.190, a critical resistance. The 38.2% Fibonacci retracement of the 60-day swing (70.140-110.190) is at 95.148, serving as strong support. Bias: Bullish above 106.240, invalidated below 106.240.
Natural gas: Natural gas is down 0.45% at 2.88300, trading within a tight session range of 2.87000-2.89100. It is positioned above its 20-day MA at 2.85750 and 50-day MA at 2.84270, indicating short-term strength. However, it remains significantly below its 200-day MA at 3.25890, signifying a long-term bearish trend. The 38.2% Fibonacci retracement of the 60-day swing (2.61600-3.44100) is at 3.12574, a key resistance level. Bias: Neutral below 2.89100, invalidated above 2.89100.
RATES US 10-year Treasury yield: The yield is down 0.28% at 4.96100, having declined from its previous close of 4.97500. It remains above its 20, 50, and 200-day MAs (4.76670, 4.68140, 4.37990 respectively), affirming a strong underlying uptrend. The 60-day swing high at 5.01200 represents immediate resistance, with the current move suggesting a slight retreat from this peak. The 38.2% Fibonacci retracement of the 60-day swing (4.36300-5.01200) is at 4.76294, near the 20-day MA. Bias: Bullish above 4.96100, invalidated below 4.96100.